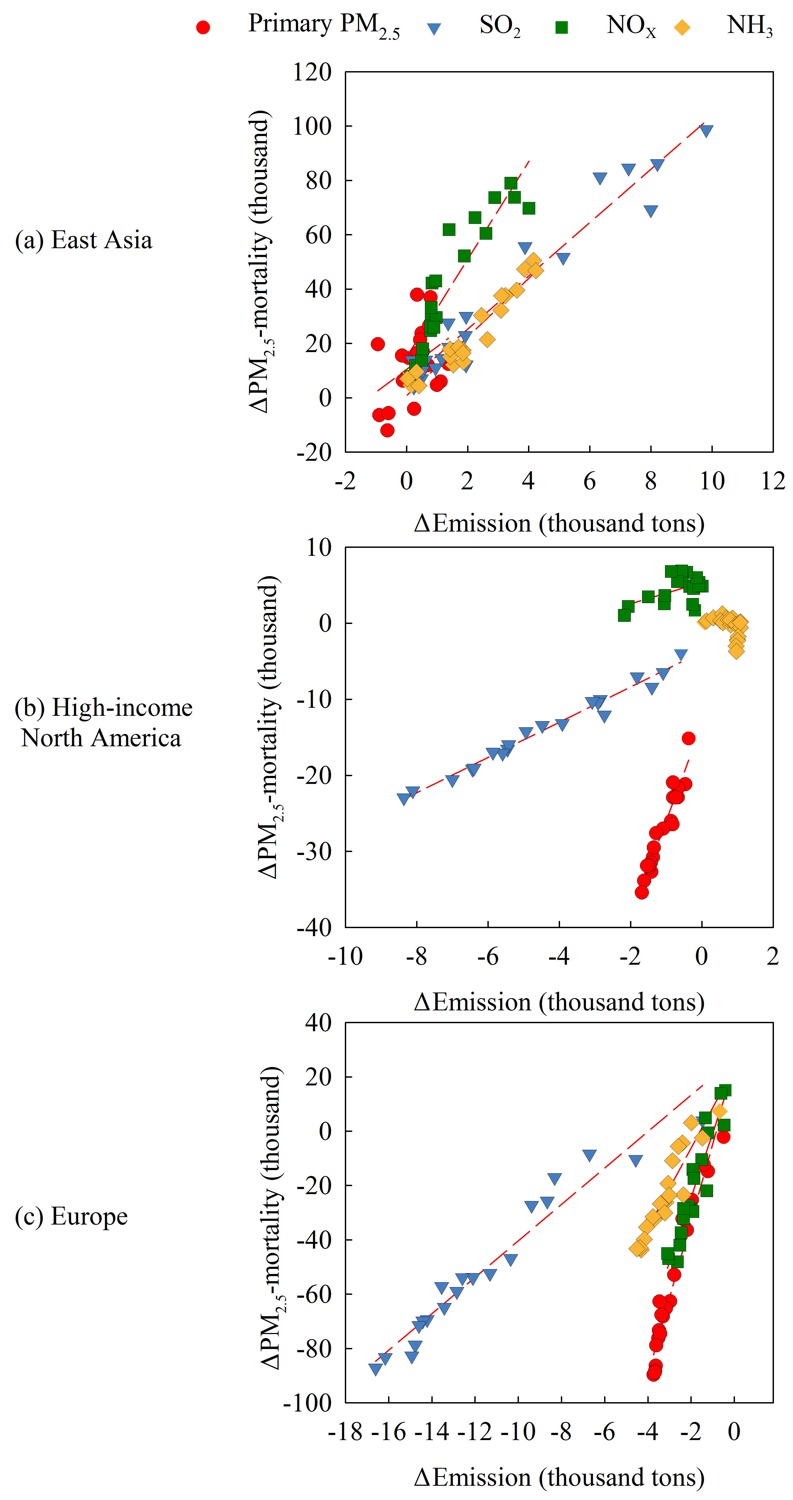
Figure 6.

Relationship between changes in PM2.5-mortality and changes in emissions in three regions: (a) East Asia, (b) high-income North America, and (c) Europe. Each data point represents the change for each year during 1991–2010 relative to 1990. The slope of the linear regression between the variables represents the emission mitigation efficiency [i.e., emission mitigation efficiency (EME)].
