
Figure 3.
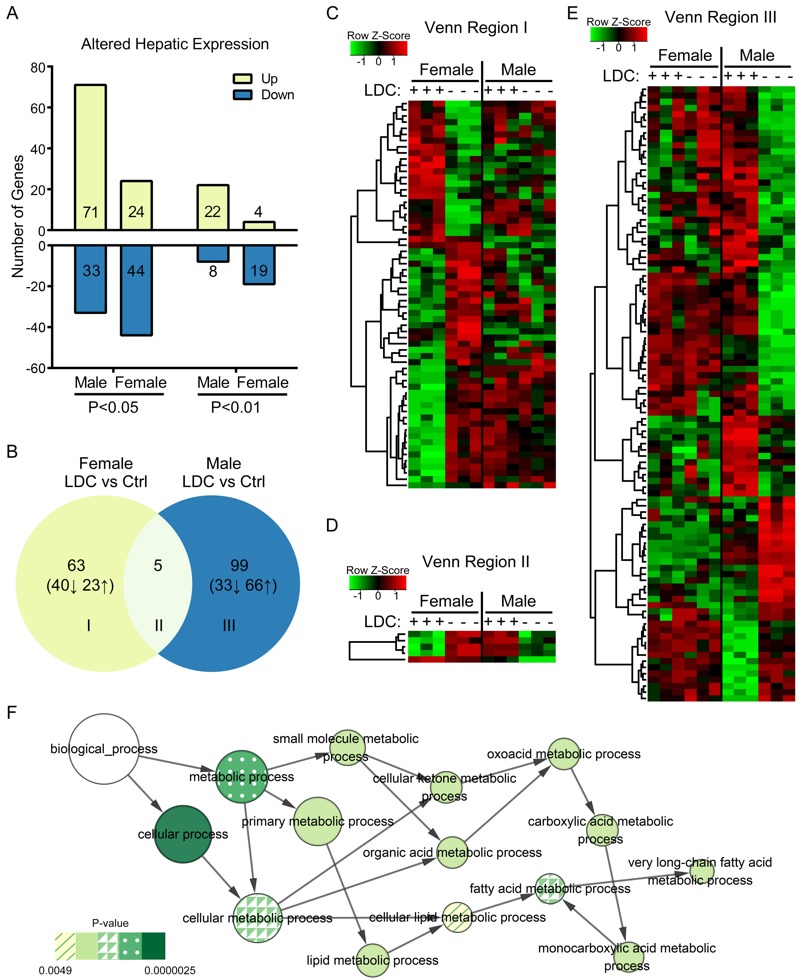
Effect of early-life LDC exposure on hepatic gene expressions. (A) Number of LDC-induced differentially expressed hepatic genes (p < 0.05 or 0.01, fold change ≥ 2) in male and female mice. (B) The differential expression of hepatic genes was comparatively analyzed. A Venn diagram represents the numbers of overlapping genes between two separate pairwise comparisons: male mice [LDC vs. Control (Ctrl)] and female mice (LDC vs. Control). (C–E) The expression values of genes in Venn regions I–III were shown in heatmaps. (F) The lipid metabolism-related biological processes enriched by up-regulated differential genes in LDC male mice were represented in the GO analysis network. Node size shows the number of genes annotated in each GO term and the node color represents the significance of the enrichment.