
Figure 3.
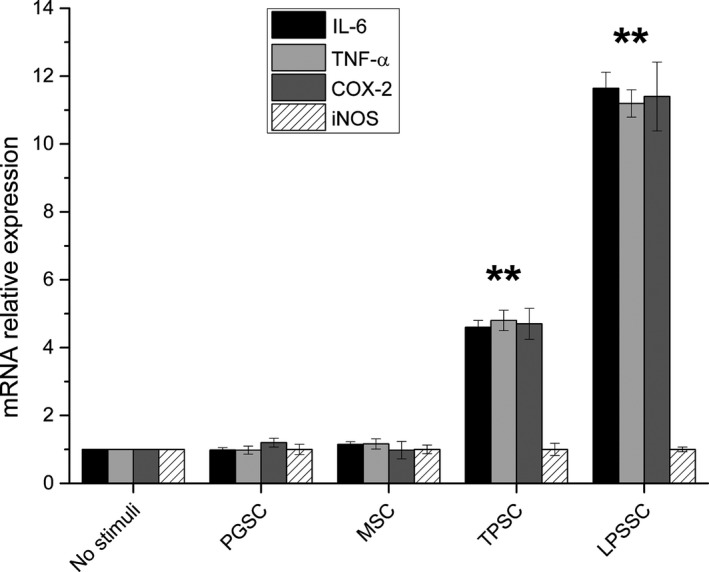
Relative expression of interleukin‐6, tumor necrosis factor alpha, cyclooxygenase 2, and inducible nitric oxide synthase in peripheral blood mononuclear cell after 24 h stimulation with glucans and lipopolysaccharide. Results were expressed as fold‐increase respect to control and plotted as the mean ± SD. ** = P < 0.01 versus no stimuli.