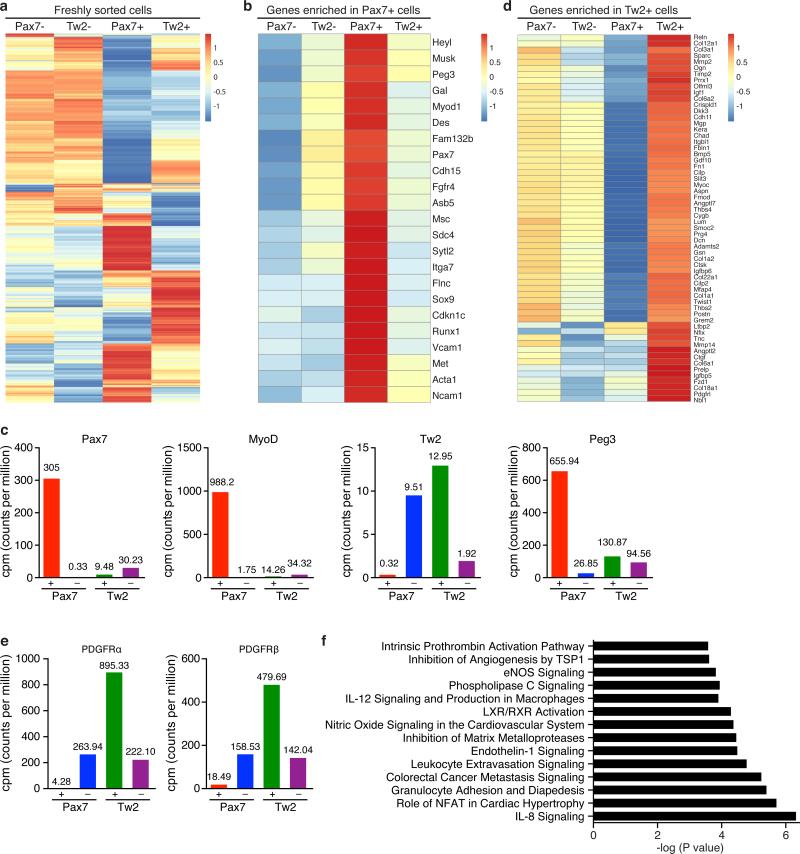
Figure 5. Molecular profiling of the Tw2+ lineage in skeletal muscle.
(a) Heat map of 4980 genes expressed in freshly sorted Tw2+, Tw2− Pax7+ and Pax7− cells identified by RNA-seq. Cells were isolated by FACS sorting from Tw2-CreERT2; R26-tdTO mice and Pax7-CreERT2; R26-tdTO mice at 10 days post-TMX, respectively.
(b) Heat map of the top 23 genes enriched in Pax7+ cells compared to Pax7− cells.
(c) CPM (counts per million) of Pax7, MyoD, Tw2, Peg3 expression by RNA-seq in Tw2+, Tw2−, Pax7+ and Pax7− cells.
(d) Heat map of top 60 genes enriched in Tw2+ cells relative to Tw2− cells.
(e) CPM (counts per million) of PDGFRα and PDGFRβ expression by RNA-seq in Tw2+, Tw2−, Pax7+ and Pax7− cells.
(f) Pathways enriched in freshly sorted Tw2+ cells relative to Tw2− cells identified by Ingenuity Pathway Analysis (IPA).

