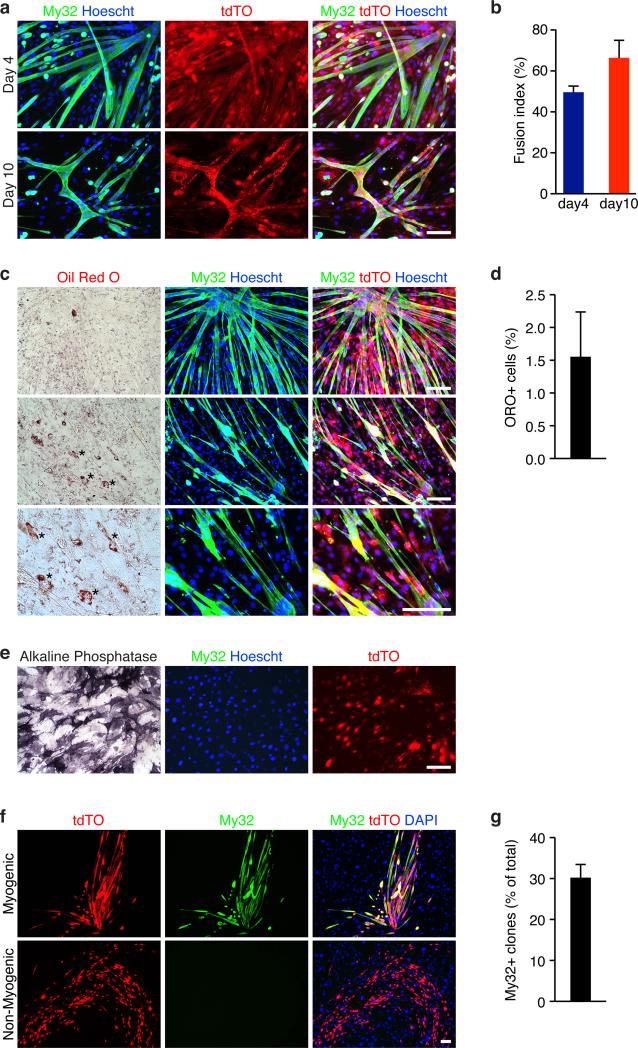
Figure 7. Myogenic and osteogenic potential of tdTO+/CD34- cells in vitro.
(a) Myosin staining (My32, green) revealed tdTO+/CD34− cells expressed myosin and formed multinucleated myotubes after 4 and 10 days in DM. Freshly sorted tdTO+/CD34− cells were cultured in GM for 48 hrs before induction of myogenesis. Scale bar: 20 um.
(b) Fusion index was calculated as the percentage of tdTO+ nuclei within multinucleated myotubes compared to the total number of tdTO+ nuclei in the culture. Data are mean ± SEM. N =3 independent experiments.
(c) Oil Red O staining revealed that only very few tdTO+ cells differentiated into adipocytes. Freshly sorted tdTO+/CD34- cells were cultured in GM for 48 hrs before induction of adipogenesis for 10 days. Cells were first stained with My32 and Hoechst before oil Red O staining. Scale bar: 20 um.
(d) Percentage of oil Red O positive cells per field. Data are mean ± SEM. N =3 independent experiments. For each experiment, more than 500 nuclei per field and total of 3 fields were counted and averaged.
(e) Alkaline phosphatase staining revealed tdTO+/CD34- cells can form osteoblasts when exposed to osteogenic medium. These cells did not express myosin. Scale bar: 20 um.
(f) Clonal analysis of tdTO+/CD34 cells for myogenic potential. Five 96-well plates were seeded by FACS. Single tdTO+/CD34 clones were grown on inactivated MEF feeder layers and induced for myogenesis. Myogenic clones were identified by My32 staining. DAPI staining identified both Tw2+ cells (tdTO+/CD34-) and MEFs. Scale bar: 100 um.
(g) Percent of myogenic clones (My32+) of the total surviving clones in the clonal analysis. Data are mean ± SEM. N=5 independent experiments.
Statistic source data for b,d,g are provided in Supplementary Table 3.

