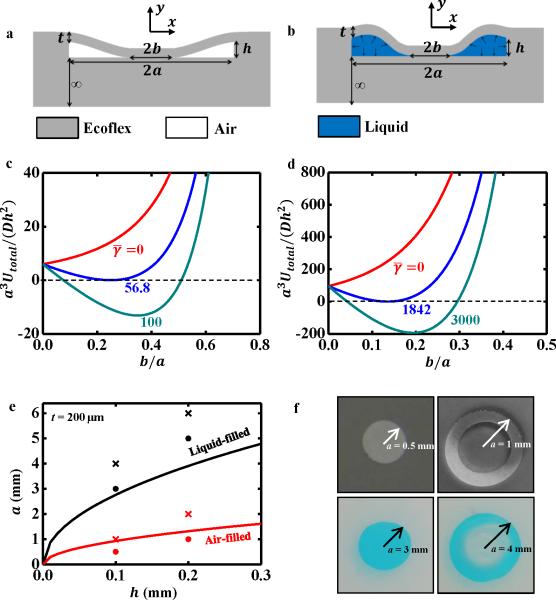
Figure 3.
Comparison of the collapse of air-filled and liquid-filled cavities. a-b) Schematic illustrations of collapse of cavities filled with a) air and b) liquid. c-d) Normalized total potential energy [a3Utotal/(Dh2)] versus normalized collapse length (b/a) with several normalized values of the work of adhesion () for c) air-filled and d) liquid-filled cavities. e) Critical half-length a of the cavity as a function of the cavity height h obtained by the analytic model (solid lines) and the corresponding experimental measurements – the cross symbols (×) represent samples that collapsed while the solid circles (•) represent samples that did not collapse. f) Photographs showing transition from no collapse to collapse for cavities filled with air (top) and ionic liquid (bottom).

