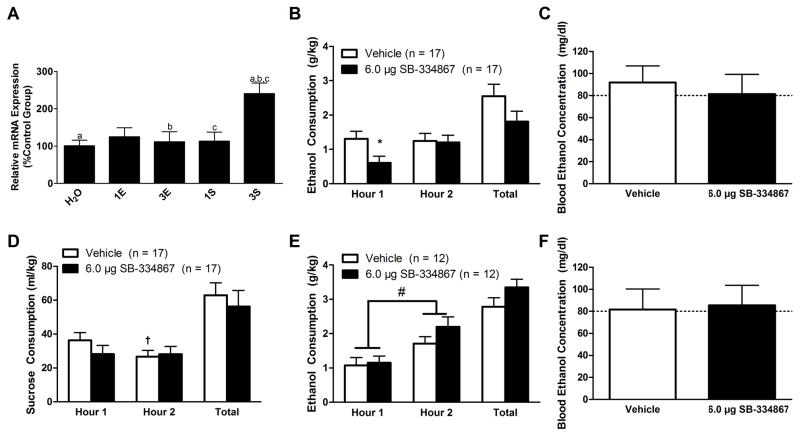
Figure 1.
Expression of prepro-orexin mRNA within the hypothalamus (N = 50; n = 10/group) following binge-like ethanol drinking as well as the effect of inhibiting signaling onto OX1Rs in the VTA on binge-like drinking behavior. PCR analysis revealed that the three cycles of binge-like sucrose consumption produced a marked increase in prepro-orexin mRNA expression within the hypothalamus relative to all other groups except for the one-cycle ethanol group (A). Inhibition of OX1Rs in the VTA selectively reduces binge-like ethanol consumption. Animals infused with SB directly into the VTA exhibited blunted binge-like ethanol consumption relative to vehicle-treated controls but only during the first hour of testing (B). Despite this reduction in consumption, no significant effect was observed in BECs as measured at the end of the two hour test period (C). Interestingly, intra-VTA infusion of SB did not significantly affect binge-like sucrose consumption at any point during the test (D), though a significant Time×Dose interaction revealed that vehicle-treated animals drank significantly more sucrose during the first hour of testing relative to the second. Importantly, this phenomenon was specific to the VTA treatment as SB infused directly dorsal to the VTA did not significantly impact binge-like ethanol drinking (E) or subsequent BECs (F) at the end of the two hour test period. We did, however, observe that animals drank significantly more ethanol during the second hour of testing relative to the first hour regardless of treatment group. H2O, water group; 1E, one-cycle ethanol group; 3E, three-cycle ethanol group; 1S, one-cycle sucrose group; 3S three-cycle sucrose group. Bars that share the same letter in (A) are significantly different from one another (p < 0.05). * denotes that p < 0.05 relative to vehicle-treated animals during the first hour of testing. † signifies that p < 0.05 relative to vehicle-treated animals during the first hour of testing. # denotes that animals drank significantly more during the second hour of testing relative to the first hour regardless of treatment group. Dotted line in (C, F) delineates 80 mg/dl, the minimum BEC to constitute a binge episode. Data presented as Mean ± SEM.

