
Figure 3. Knockdown of DOCK2 results in decreased cell proliferation and decreased colony formation in cell lines that express FLT3.
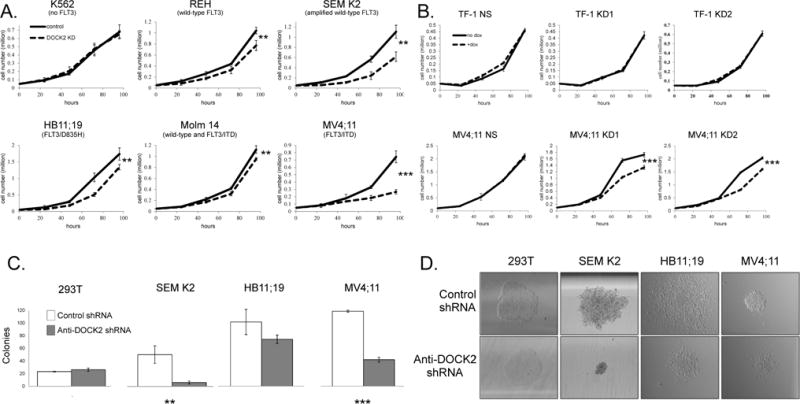
(A) Cells with stable expression of anti-DOCK2 shRNA were seeded at less than 0.1 million cells/ml to maximize the observable difference in proliferation, and counted every 24 hours. Cell lines expressing FLT3 showed decreased cell proliferation when expression of DOCK2 was reduced (REH, HB11;19, Molm 14, and SEM K2, P ≤ 0.01, **), and pronounced changes were observed in MV4;11 cells (P=0.0002, ***). Assays were performed in triplicate. (B) Induced expression of two shRNAs directed against DOCK2 in MV4;11 cells also resulted in decreased cell proliferation in assays that were performed in triplicate. TF-1 cells that lack FLT3 expression served as negative control. (C) Colony formation assays performed in triplicate showed that stable knock-down of DOCK2 led to significantly decreased colony formation in SEM K2 (P ≤ 0.01, **) and MV4;11 cells (P ≤ 0.001, ***). HB11;19 cells showed a trend in keeping with the SEM K2 and MV4;11 cells, but the difference was not statistically significant. HEK 293T cells that lack both DOCK2 and FLT3 were used as a negative control. Colony numbers were counted two weeks after plating. (D) Qualitative changes in colony morphology were seen in cell lines that express FLT3. Images were acquired at 40X using a Nikon Eclipse Ti microscope at room temperature two weeks after plating. All images are shown at the same scale.