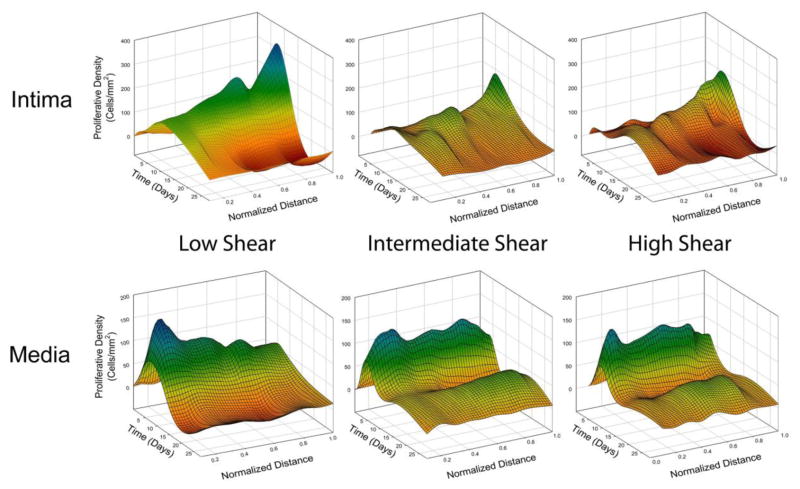
FIGURE 8.
Spatial and temporal patterns of cell proliferation within the intima and media. To facilitate registration of the data, the intima and media for each graft specimen was virtually divided into 10 circumferential sections of equal thickness. For the intima, zero represents the section directly bordering the lumen, 0.5 represents the middle of the intima, and 1.0 represents the section bordering the IEL. For the media, zero represents the IEL, 0.5 represents the middle of the media, and 1.0 represents the section bordering the EEL. Note the peak in proliferative density in the intimal and medial regions that are adjacent to the IEL.

