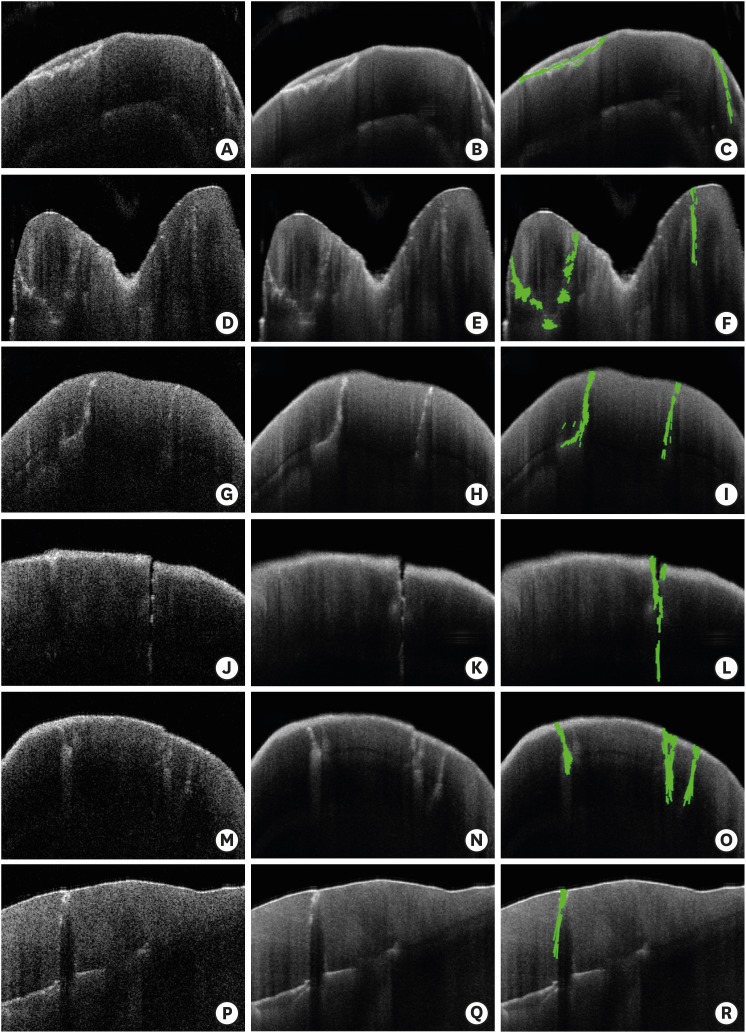
Figure 4.
(A, D, G, J, M, and P) Single OCT images showing high noise. (B, E, H, K, N, and Q) OCT images were acquired 100 times, indicating that the noise was improved by image averaging. (C, F, I, L, O, and R) After averaging, crack lines were detected with the Hough transform.
OCT, optical coherence tomography.

