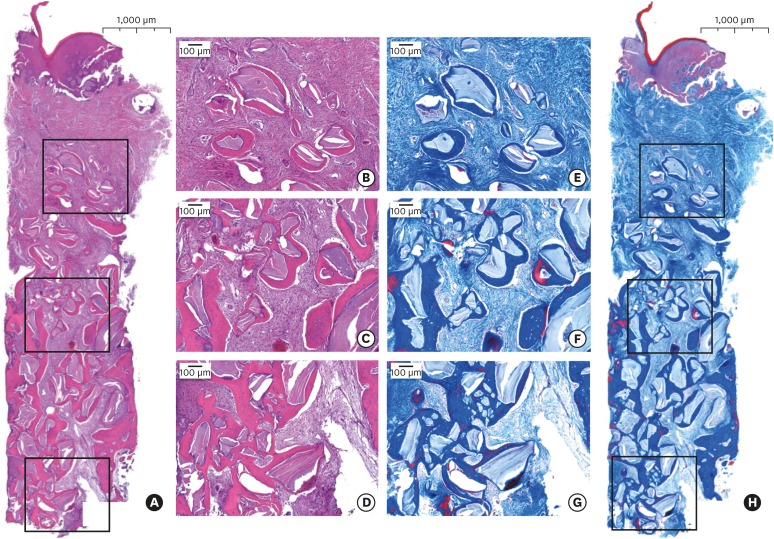
Figure 5.
Representative image of histologic specimens of the test group (30 N of compressive force). Hematoxylin and eosin (left panels, A, B, C, D) and Masson trichrome (right panels, E, F, G, H) staining. The inset boxes in the less magnified image indicate the relevant areas in the more magnified images.

