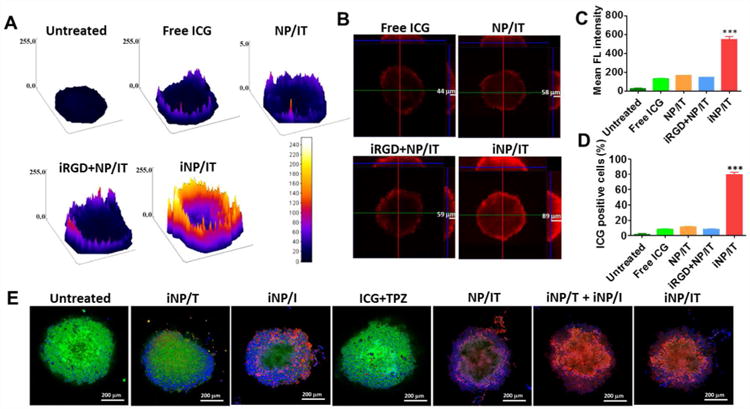
Figure 4.

Penetration and cell killing activity of the nanoparticles in 4T1 spheroids. (A) Surface plot images of 4T1 spheroids treated with free ICG, NP/IT, iRGD+NP/IT, iNP/IT and negative control. (B) Confocal microscopy images of spheroids after different treatments (X, Y and Z direction). (C) and (D) Accumulation of ICG in 4T1 cells from spheroids as indicated with mean fluorescence intensity and positive cell percent after flow cytometry analysis. Results are shown as mean ± SD, n = 3. ***p < 0.001 vs. iRGD+NP/IT. (E) Representative confocal images of live/dead viability assay in 4T1 spheroids treated with different formulations for 24 h (w or w/o NIR irradiation). Live cells were stained with calcein AM (green), the dead cells were labeled with EthD-1 (red). Nucleus was stained with Hoechst 33258 (blue).
