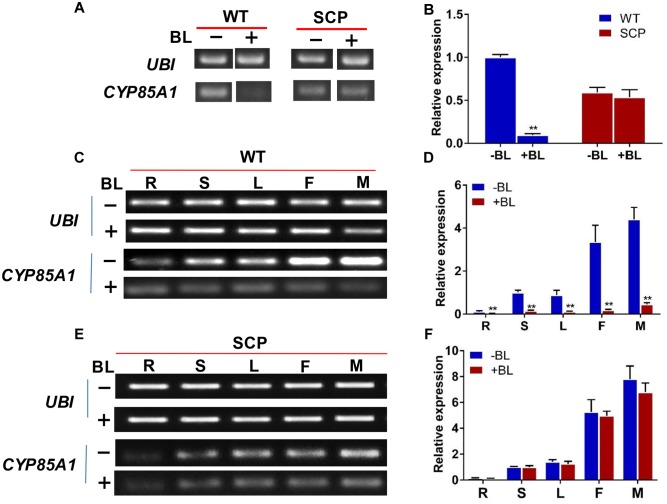
FIGURE 6.
Expression level of the CsCYP85A1 candidate gene in WT and C257 plants with BL treatment revealed from semi-quantitative PCR (A,C,E) and qPCR (B,D,F). The expression of scp-1/CsCYP85A1 in WT plants was dramatically reduced by treatment with 100 μM BL (A,B), which was the same in various organs at flowering stage (C,D). Exogenous BL treatment did not alter scp-1/CsCYP85A1 expression in the mutant C257 (A,B,E,F). ∗∗Indicates statistically significant differences of expression level based on t-test (P < 0.01). R, S, L, F, and M represents root, stem, leaf, female flower, and male flower, respectively.

