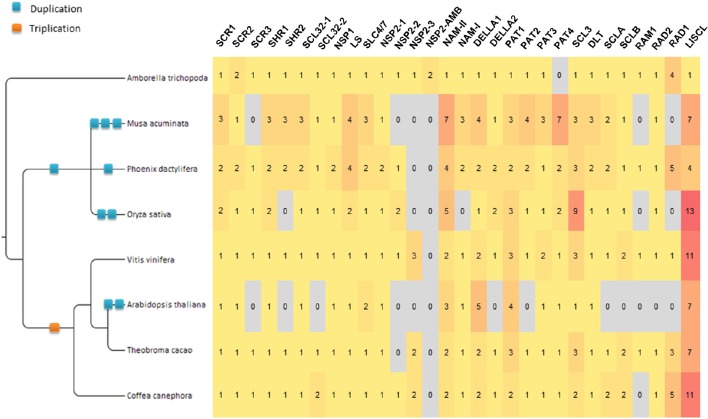
Figure 1.
GRAS Gene distribution by orthogroup in 8 plant species. Numbers in the matrix represent the number of genes by OG specified in the header (with the exception of NSP2-AMB). The gradient color from yellow to red illustrates the abundance of genes. The WGD involving the ancestor of all the studied dicot species (γ event, hexaploidization) is indicated by an orange square.

