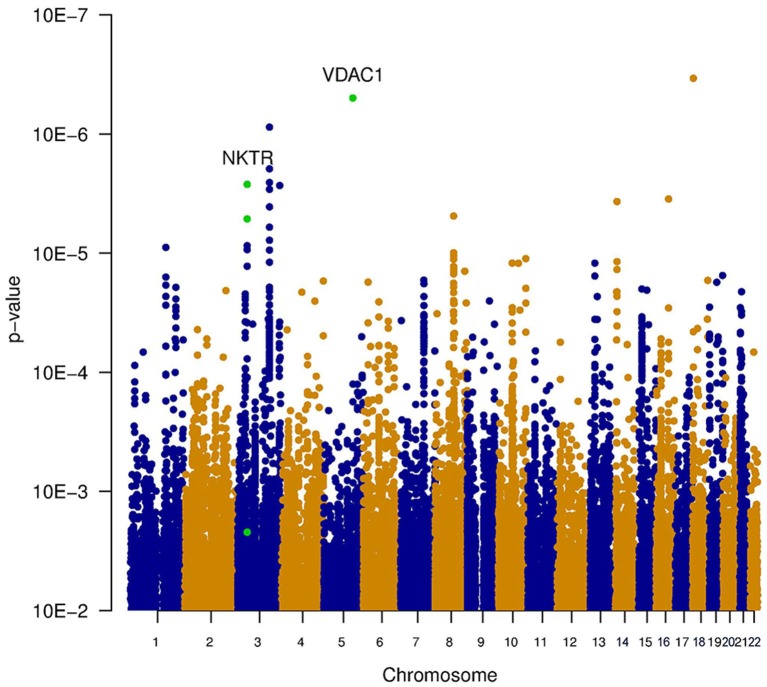
Figure 1.
Manhattan plot illustrating the main effect of the SNPs on the phenotype, tested via the association between tinnitus and the genotype without accounting for noise exposure. This highlights the SNPs that lead to an increased risk for tinnitus across both noise-exposed and non-exposed individuals. None of the SNPs reached the threshold for genome-wide significance (p < 5e−8). The most significant SNPs reach a p-value of 3.4e−7. Two genes contain SNPs with a p-value below 1e−5 (VDAC1 and NKTR). These SNPs are indicated in green.

