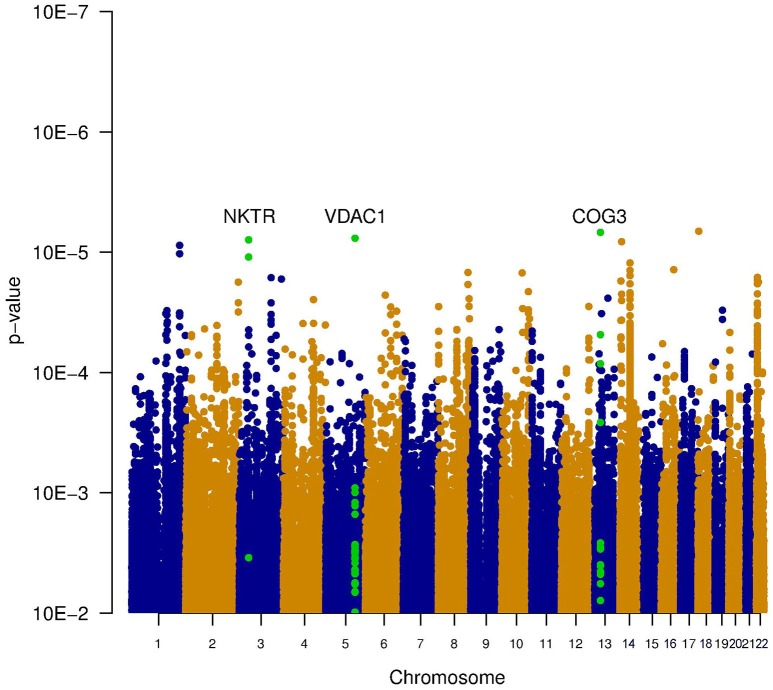
Figure 3.
Manhattan plot illustrating the joint test for genotype and interaction with noise. This test combines the significance of the main effect test (Figure 1) and the interaction test (Figure 2). Two genes contain SNPs with a p-value below 1e-5 (VDAC1 and NKTR). The SNPs within these genes are shown in green.

