Figure 8.

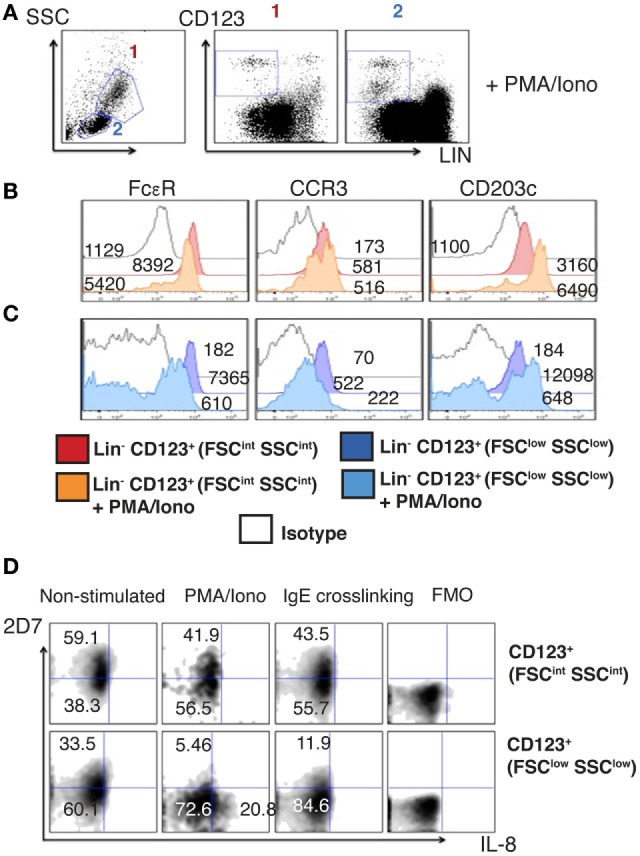
The Lin− CD123+ CD127low population from the lymphoid region after activation downregulates CD123 and basophil markers. (A) Prospective identification of two CD123+ cell populations in the FSCint SSCint and FSClow SSClow fractions as FSCint SSCint (1) and FSClow SSClow (2) after activation with PMA/Iono (6 h). (B,C) Basophil markers expression after PMA/Iono (6 h) stimulation in the Lin− CD123+ (FSCint SSCint) and Lin− CD123+ (FSClow SSClow). Red: non-stimulated and orange: stimulated Lin− CD123+ (1: FSCint SSCint). Dark blue: non-stimulated and light blue: stimulated Lin− CD123+ (2: FSClow SSClow). White: isotype. Median fluorescence intensity values representative of three independent experiments are presented. (D) 2D7 and IL-8 expression after PMA/Iono (6 h) stimulation or IgE crosslinking. Upper panel: Lin− CD123+ (FSCint SSCint) and lower panel: Lin− CD123+ (FSClow SSClow). FMO: for each population is shown at the right of each panel. Density plots are representative of at least three independent experiments. FMO, fluorescence minus one control.
