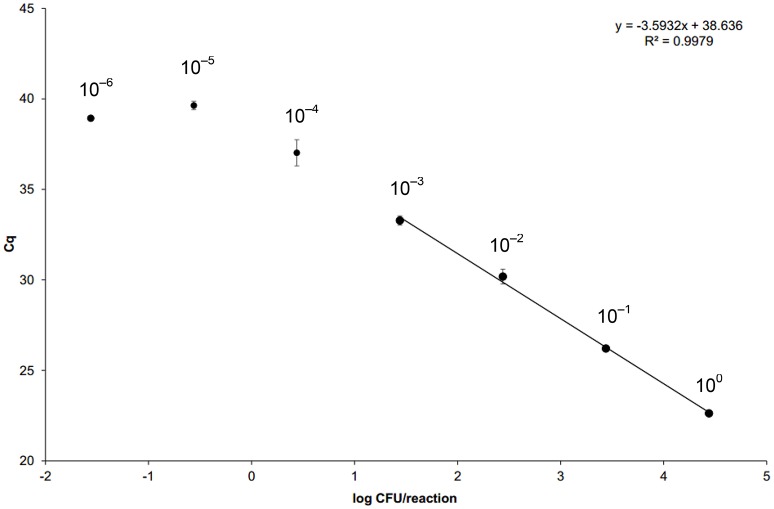
Figure 1.
Standard curve for qPCR based on average cycle of quantification (Cq) values plotted against the estimated number of target copy number per reaction. Negative poultry neck-skin samples were spiked with 100 μl of 10-fold dilution series, prepared from the overnight Campylobacter jejuni culture (1.1 × 10⁸ CFU/ml) and ranging from 1.1 × 10⁷ CFU/ml (dilution 100) to 1.1 CFU/ml (dilution 10−7). All dilutions were spiked in triplicates (biological replicates) and samples processed as employed for the naturally contaminated poultry neck skin. After DNA extraction, all biological replicates were tested with qPCR in three technical replicates. Amplification efficiency (E = 10−1/slope − 1) of the reaction was 89.80%. For the calculation of standard curve equation, only data belonging to the linear dynamic range was considered (coefficient of variation <33%). Dilutions 10−7 gave negative results. Error bars represent standard deviations of averaged Cqs. For raw data, see Table 1.

