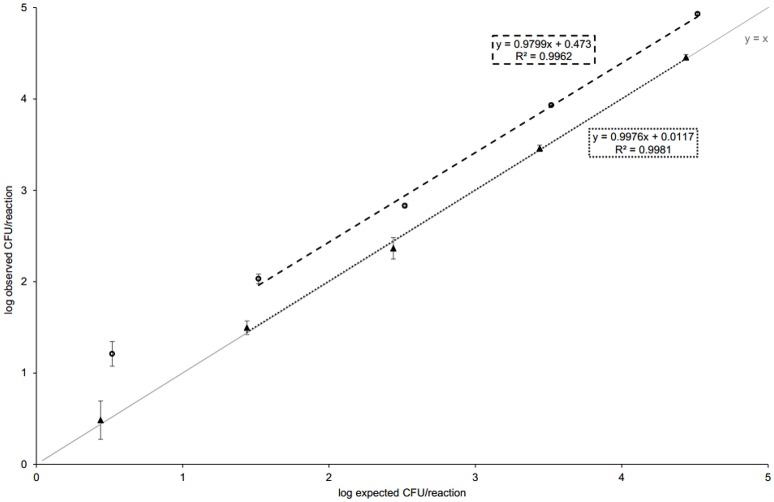
Figure 2.
The performance of qPCR and dPCR. Standards were prepared and qPCR performed as described in Figure 1. For dPCR, each biological replicate was run on a single chip. The expected values were obtained from plate counting and the solid line represents CFU observed equaled to CFU expected (y = x). In dPCR, the absolute copy numbers were obtained (absolute quantification), whereas in qPCR, the observed value was calculated from the standard curve (relative quantification). Five 10-fold dilutions from 100 to 10−4 are shown. For the calculation of standard curve equation in qPCR, only data belonging to the linear dynamic range was considered (coefficient of variation <33%). In dPCR, same dilutions were used as they all generated precision up to ~10%. For raw data, see Tables 1, 3. Error bars represent standard deviations in qPCR and confidence intervals in dPCR, respectively.

