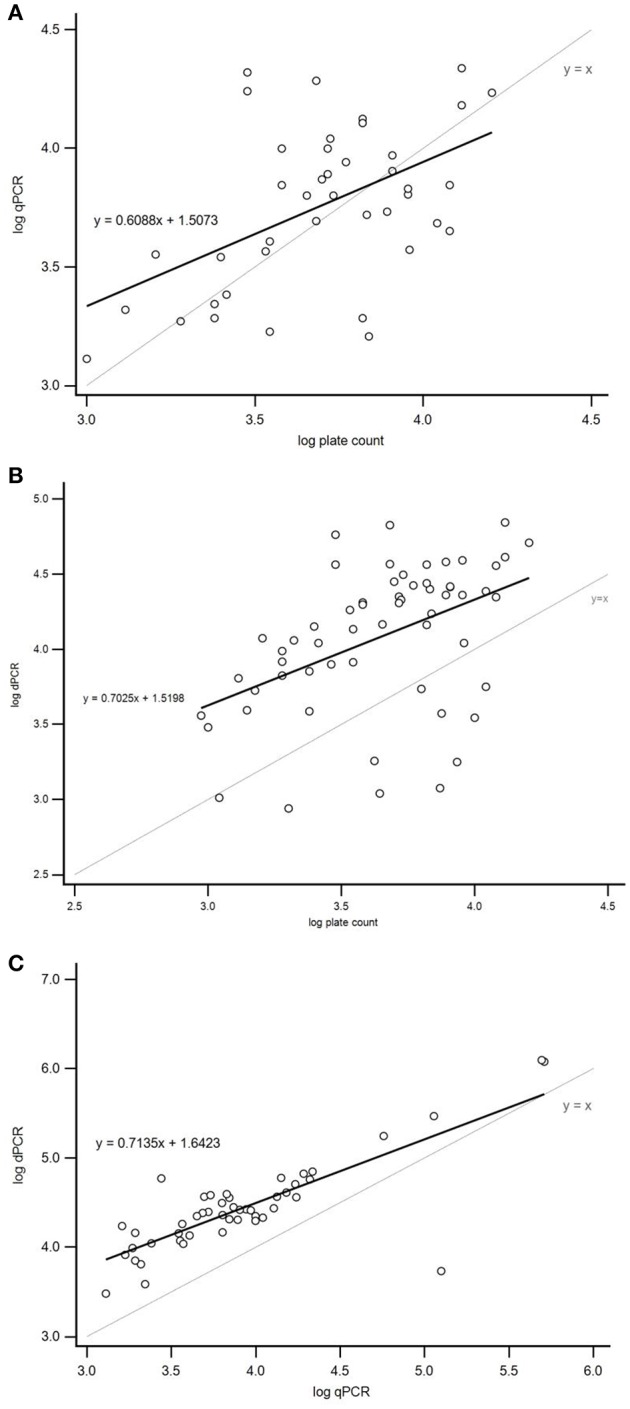
Figure 3.

Linear regression analysis of the log CFU/g numbers observed by the plate count method, qPCR and dPCR for quantification of Campylobacter jejuni in 75 naturally contaminated broiler neck-skin samples (15 pooled and 60 individual). (A) Correlation between qPCR and plate count method: linear trend line equation (thick continuous line). Correlation between variables was moderate and statistically significant (r = 0.513; p = 0.0006, N = 41). (B) Correlation between dPCR and plate count method was moderate and statistically significant (r = 0.458; p = 0.0003, N = 59). (C) Correlation between dPCR and qPCR was strong and statistically significant (r = 0.805, p < 0.0001, N = 48). Thin continuous lines in all three graphs represent line of equality (y = x). r, Pearson correlation coefficient.
