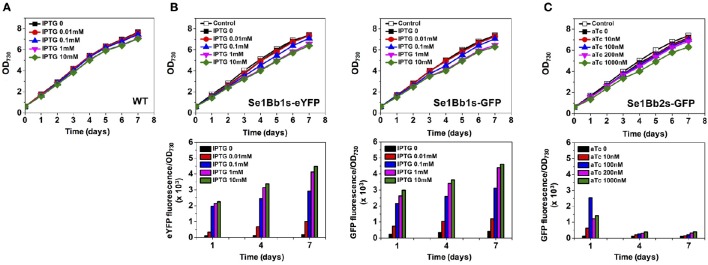
Figure 2.
Gene expression analysis of engineered S. elongatus PCC 7942 using SyneBrick vectors. (A) Growth of S. elongatus PCC 7942 wild type under 5% (v/v) CO2 bubbling in BG-11 supplemented with indicated concentrations of IPTG measured at OD730 (black square, 0 mM; red circle, 0.01 mM; blue triangle, 0.1 mM; inverted pink triangle, 1 mM; green diamond, 10 mM). (B) Growth of engineered S. elongatus PCC 7942 (Se1Bb1s-eYFP and Se1Bb1s-GFP) under 5% (v/v) CO2 bubbling in BG-11 supplemented with indicated concentrations of IPTG, measured at OD730 (upper panel). Specific fluorescence (intensity per OD730) for cyanobacterial cultures (lower panel). Se1Bb1s-None was the control strain (open black square). Symbols for IPTG used are as in (A). (C) Strain Se1Bb2s-GFP was used to measure growth and specific fluorescence under aTC induction (black square, 0 mM; red circle, 10 nM; blue triangle, 100 nM; inverted pink triangle, 200 nM; green diamond, 1000 nM). Experiments were performed in triplicate cultures. All data are mean ± standard deviation (SD) from triplicate cultures.

