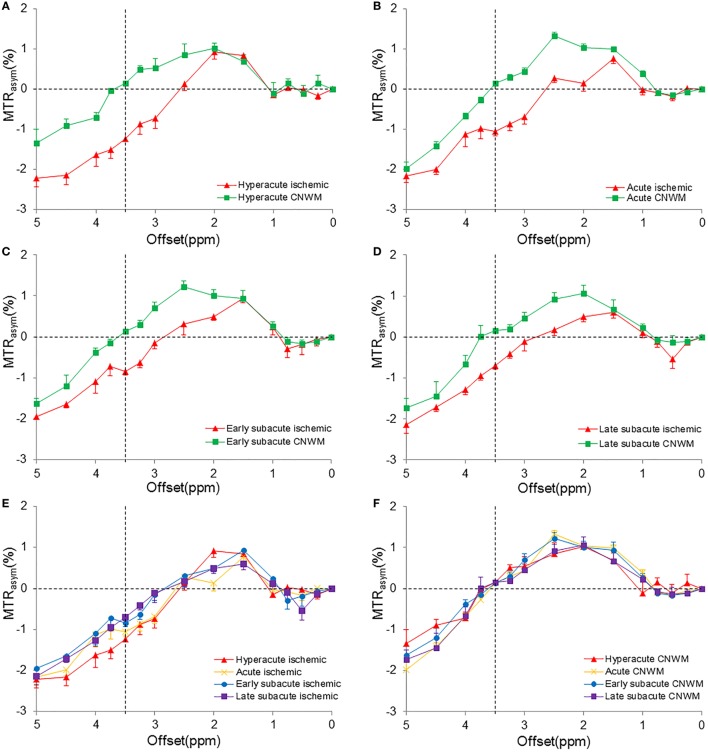
Figure 2.
Measured MTRasym spectra in the ischemic tissue and the contralateral normal white matter (CNWM) of different stages (corresponding to the APTWmin value). (A) Hyperacute stage. (B) Acute stage. (C) Early subacute stage. (D) Late subacute stage. (E) The combination of MTRasym spectra in the ischemic tissue of different stages. (F) The combination of MTRasym spectra in the CNWM of different stages. The chemical exchange saturation transfer effect reduced in the offset range of 2–5 ppm in all stages. MTRasym(3.5 ppm) showed the largest reduction in the hyperacute stage (A). An increase was shown in the MTRasym(3.5 ppm) in the ischemic tissue (E).

