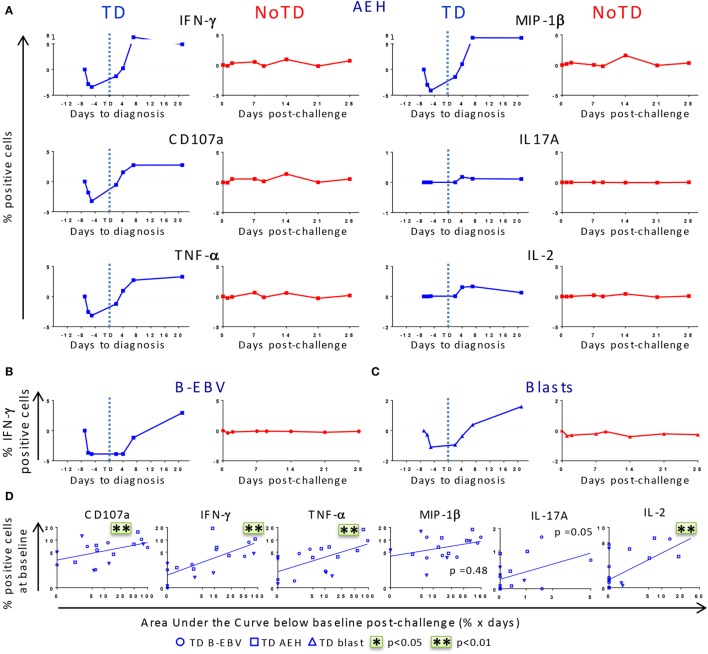
Figure 3.
Distinct kinetics of responsive CD8+ T cell responses against Salmonella enterica serovar Typhi (S. Typhi) after challenge. (A) Kinetics for a representative participant from each group (TD and NoTD) showing the production of cytokines/chemokines and expression of CD107a by CD8+ TEM following stimulation with S. Typhi-infected AEH cells at different time points after challenge. (B,C) Kinetics of IFN-γ production is shown for a representative volunteer after stimulation with S. Typhi-infected B-EBV cells and S. Typhi-infected blasts. (D) Areas under the curve below baseline were measured until time to diagnosis for the six randomly selected TD participants and plotted against the baseline level of responses for each of the indicated biomarkers stimulated with S. Typhi-infected AEH cells (squares), S. Typhi-infected B-EBV cells (circles), or S. Typhi-infected blasts (triangles). Correlations analyses were performed using mixed effects models to account for multiple observations per person. **p < 0.01.

