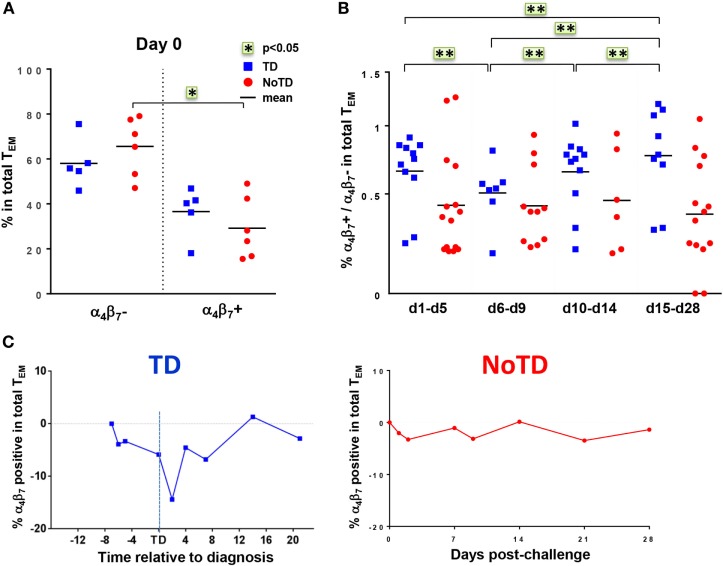
Figure 4.
Gut homing potential of total CD8+ TEM. (A) Each value represents the baseline percentages of integrin α4β7− and integrin α4β7+ cells in total CD8+ TEM evaluated by surface staining and flow cytometry for 12 randomly selected TD (squares) and NoTD (circles) participants. *p < 0.05. (B) Ratio of integrin α4β7+ to integrin α4β7− total CD8+ TEM cells are shown within four periods of time after challenge. Period d6–d9 corresponds to the time of typhoid diagnosis. Statistical analyses were performed using mixed effects models to account for multiple observations per person. **p < 0.01. (C) Kinetics of expression of integrin α4β7+ total CD8+ TEM after challenge in representative participants from each group.

