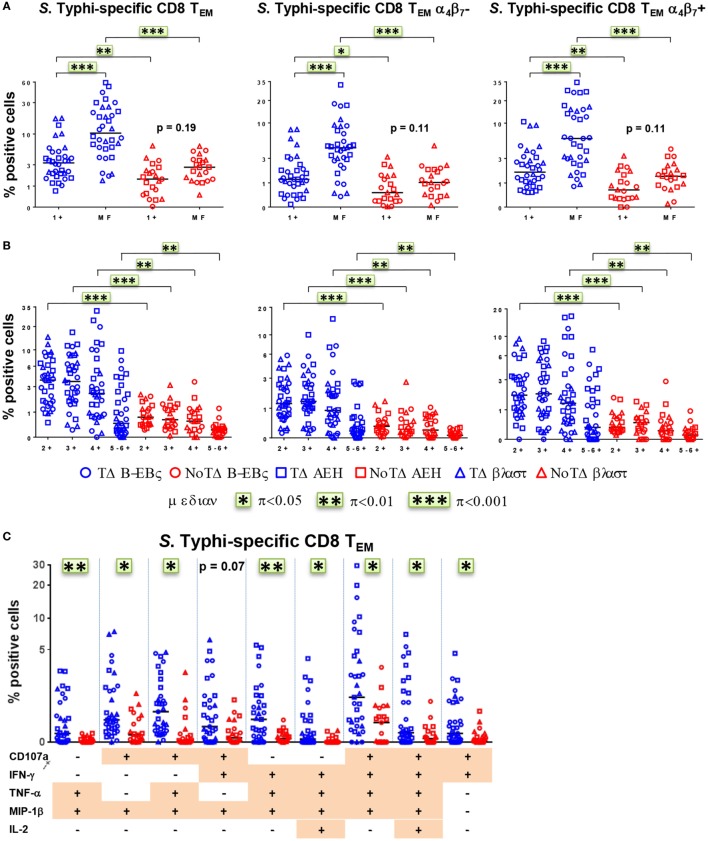
Figure 6.
Characterization of multifunctional (MF) CD8+ TEM responses against Salmonella enterica serovar Typhi (S. Typhi) at baseline. Flow cytometry data were analyzed using the FCOM function of Winlist to determine the proportion of all possible combinations of the six measured biomarkers to identify MF cells (i.e., positive for several biomarkers concomitantly). Each symbol represents the percentage of the different populations measured after stimulation with S. Typhi-infected cells [AEH cells (squares), B-EBV (circles) cells, or blasts (triangles)] for each participant (TD n = 13, NoTD n = 7). (A) The percentages of single positive cells (1+) or of total MF cells (i.e., the sum of all cells concomitantly positive for two or more biomarkers) are represented for all CD8+ TEM and for CD8+ TEM integrin α4β7− and integrin α4β7+ cells. (B) MF cells were divided into four groups on the basis of the number of biomarkers they expressed [e.g., cells expressing two biomarkers are shown as double positive (2+)]. (C) Characterization of the nine major individual populations of S. Typhi-responsive MF in CD8+ TEM. *p < 0.05, **p < 0.01, ***p < 0.001.

