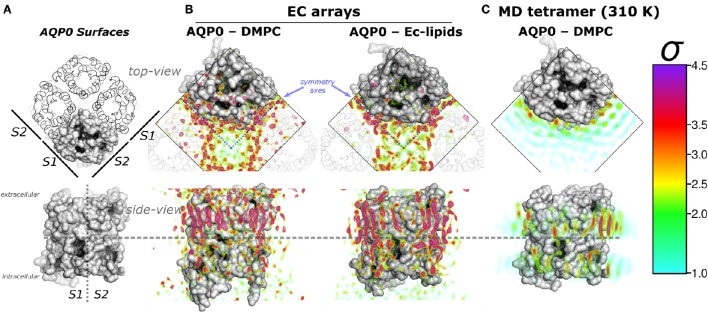
Figure 1.
Aquaporin-0 (AQP0) surfaces, electron crystallography (EC), and time-averaged molecular dynamics (MD) lipid density (ρL) comparison. Systems are shown from the extracellular side (top-view) and below, parallel to the membrane normal (side-view). (A) Shows an AQP0 tetramer with one of the monomers in a gray surface representation. The lipid exposed surfaces were labeled S1 and S2 (as in Aponte-Santamaría et al., 2012). The segmented lines in the side-view representation separate both surfaces, and the extra- and intracellular sides of an AQP0 monomer. (B,C) show identical volumes of normalized ρL, corresponding to EC and MD, respectively. The ρL were contoured in the color-coded standard deviation (σ) scale on the right. (B) Shows the masked EC-AQP0 densities (excluding the protein) solved in DMPC (Gonen et al., 2004), and E. coli polar lipids (Hite et al., 2010). In the top-view perspectives, the ρL along the symmetry axes (blue segmented lines) contact S1 and S2 surfaces of adjacent tetramers shown as transparent ribbons. Similarly stretched acyl-chain-like ρL shapes are observed in the side-view perspective. (C) Shows the time- and monomer-averaged MD-ρL of an AQP0 tetramer inserted in a DMPC bilayer, simulated at 310 K.

