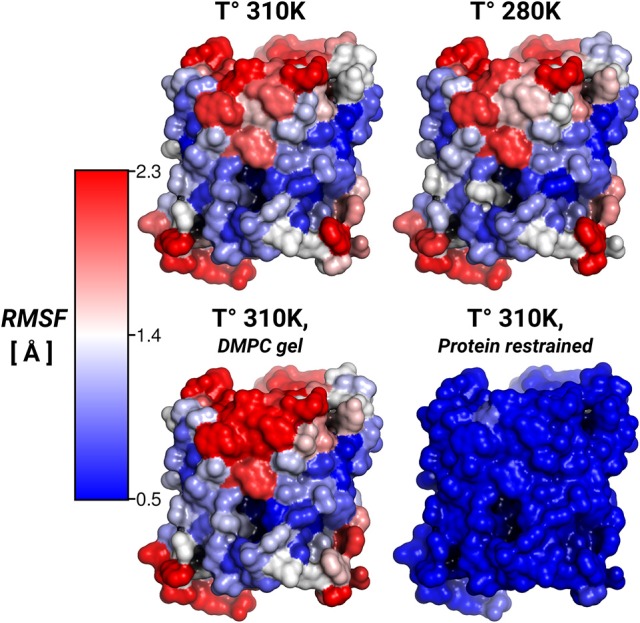
Figure 3.

Protein root-mean-square-fluctuations (RMSF). The figure displays the protein RMSF per amino acid mapped on the AQP0 surface. The RMSF color scale is shown on the left. The average protein, and backbone fluctuations of the simulations at 310, 280 K and DMPC-gel were ~ 1.7, and ~ 1.2 Å, respectively. The average fluctuations of the restrained protein simulation were smaller than 0.3 Å.
