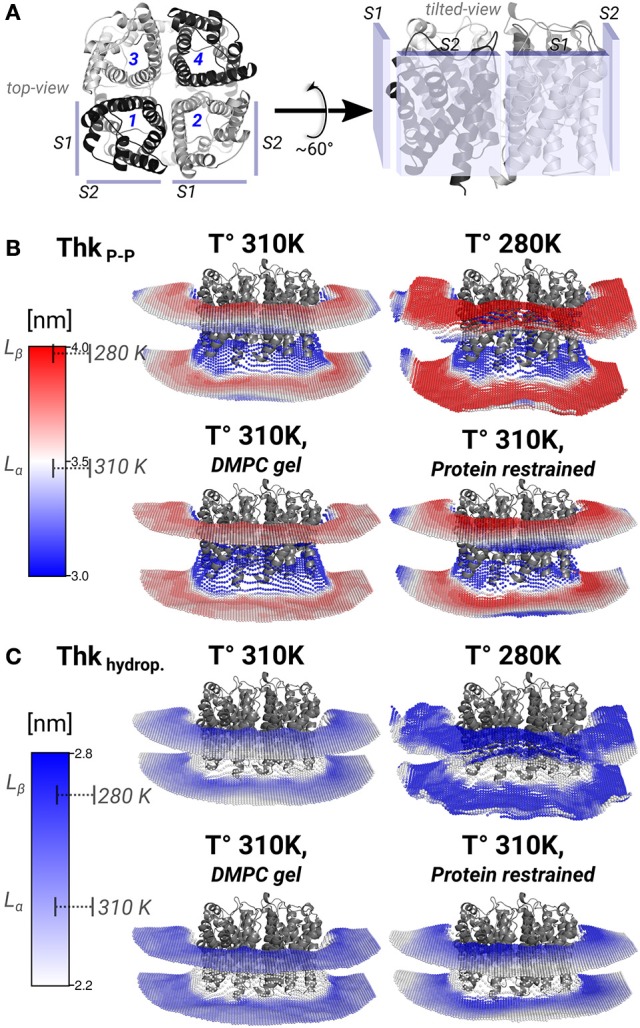
Figure 4.

Lipid thickening compensate the hydrophobic mismatch in the AQP0-DMPC system. Local inter-phosphate (ThkP–P), and hydrophobic thicknesses (Thkhydrop.) profiles. (A) Depicts AQP0 monomers with numbers, and the surfaces S1 and S2 of two adjacent monomers, from a top- and a tilted-view. The tilted-view was used in the subsequent representations. (B,C) Show monomer- and time-averaged ThkP–P and Thkhydrop. around an AQP0 tetramer. The thicknesses values were calculated with g_lomepro (Gapsys et al., 2013) in a grid of 100 × 100 bins. Only the grid elements within 6.5 nm of the tetramer center-of-mass are shown. The scales on the left show the range of thicknesses spanned by the simulations. The segmented lines on the scales mark the average (± SD) values of a simulated pure DMPC patch at 310 K (fluid-phase, Lα) and at 280 K (gel-phase, Lβ). The calculated thicknesses show that DMPC lipid thickening occurs close to the AQP0 surface at physiological temperatures. Annular lipid thickness values became close to those of gel-phase DMPC.
