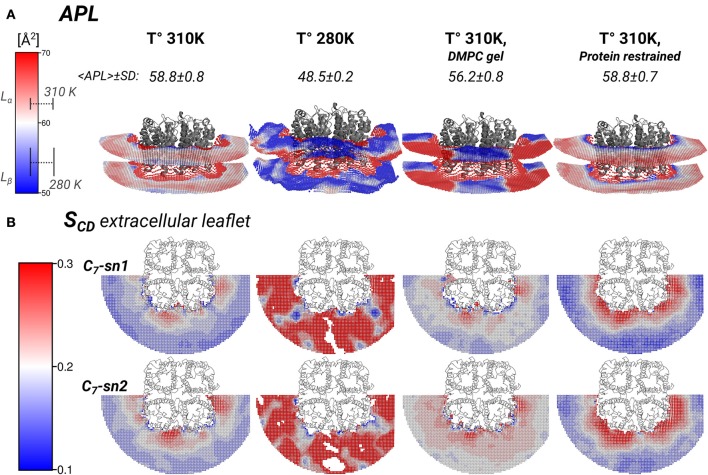
Figure 5.
Local area-per-lipid (APL), and SCD order parameters around AQP0 indicate phase prone specific subdomains. Grid elements within 6.5 nm of the tetramer center-of-mass are shown. (A) Shows the calculated local and average APL. The color-scale shows the range of APL spanned. The segmented lines on the scale mark the simulated average (± SD) values of pure DMPC-water systems. (B) Shows the calculated SCD of the carbon-7 (C7) of both acyl-chains (sn1 and sn2). On the left of the color-scale shows the value range from 0.1 to 0.3. Order parameters lower than 0.1 were omitted in the representations. Extracellular and intracellular SCD of acyl-chain carbons 2, 7, and 13 are shown in Figures S3, S4, respectively.

