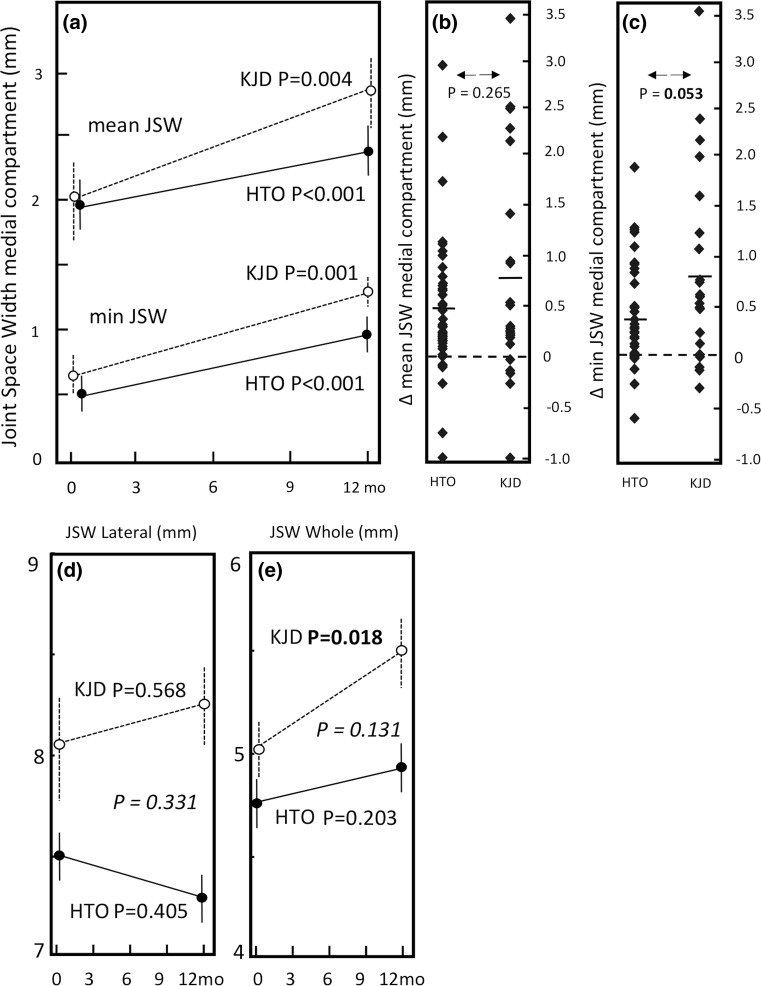
Fig. 5.
a Mean quantitative radiograph analyses of the medial (affected) compartment of both treatment groups. The solid line represents HTO group (n = 41), and the dotted line represents the knee joint distraction group (n = 22). Mean values ± SEM are presented. p values show statistical difference in values at 1-year follow-up compared to pre-treatment values. b Mean change of mean JSW of medial compartment. For both groups (average: dash) and for every individual patient (squares). c Mean change of minimum JSW of medial compartment. For both groups (average: dash) and for every individual patient (squares). d Mean JSW of the lateral (least affected) compartment of both treatment groups. e Mean JSW of the whole joint of the both treatment groups. The p value in italic shows statistical difference in change over 1 year between the two treatment groups

