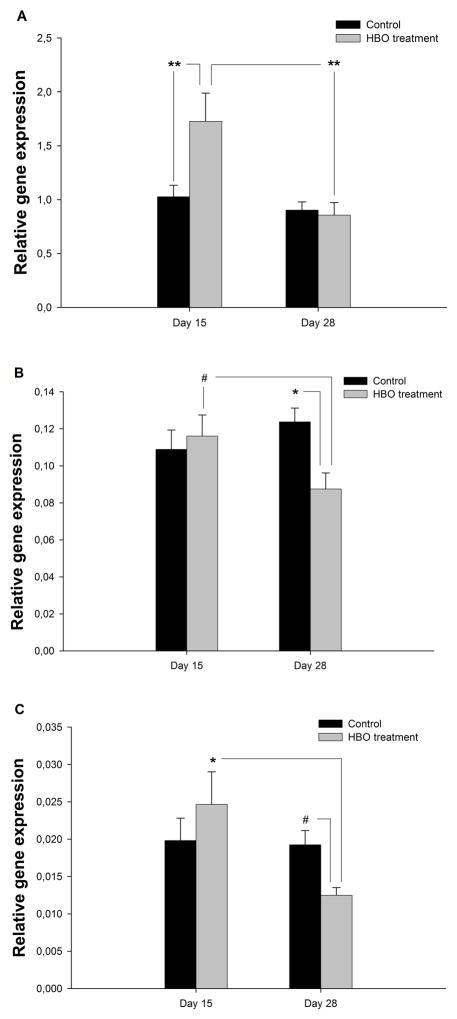
Fig. 1.
Gene expression in tissue for HBO-treated (n=17) and control groups (n=45). ANOVA was used to determine the statistical significance of the effects of time and HBO-treatment on gene expression. Bars represent the standard error of the mean (SEM). (A) Collagen type 1; (B) TGF-β1; (C) ALP. #p<.10, *p<.05, **p<.01.

