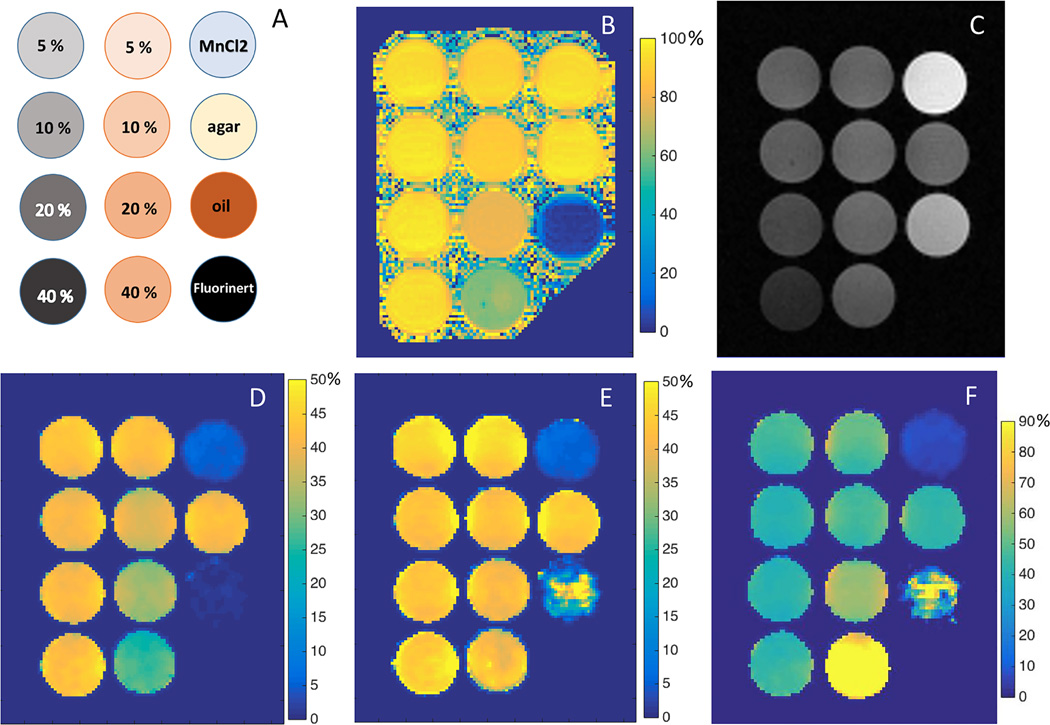
Fig. 2.
Phantom setup (A), water fraction map (B), representative MT weighted images with water and fat signals in phase (C), corresponding MTRobs maps (D), calculated MTRtrue map (E), and MTRtrue maps with water and fat signals in opposed phase (F). MT saturation pulse has a FA of 800°, length of 10 ms, and off-resonance frequency of 1 kHz; TE = 2.24 ms in (C), and TE = 3.36 ms in (F); Unit for the color bars: percent (%)

