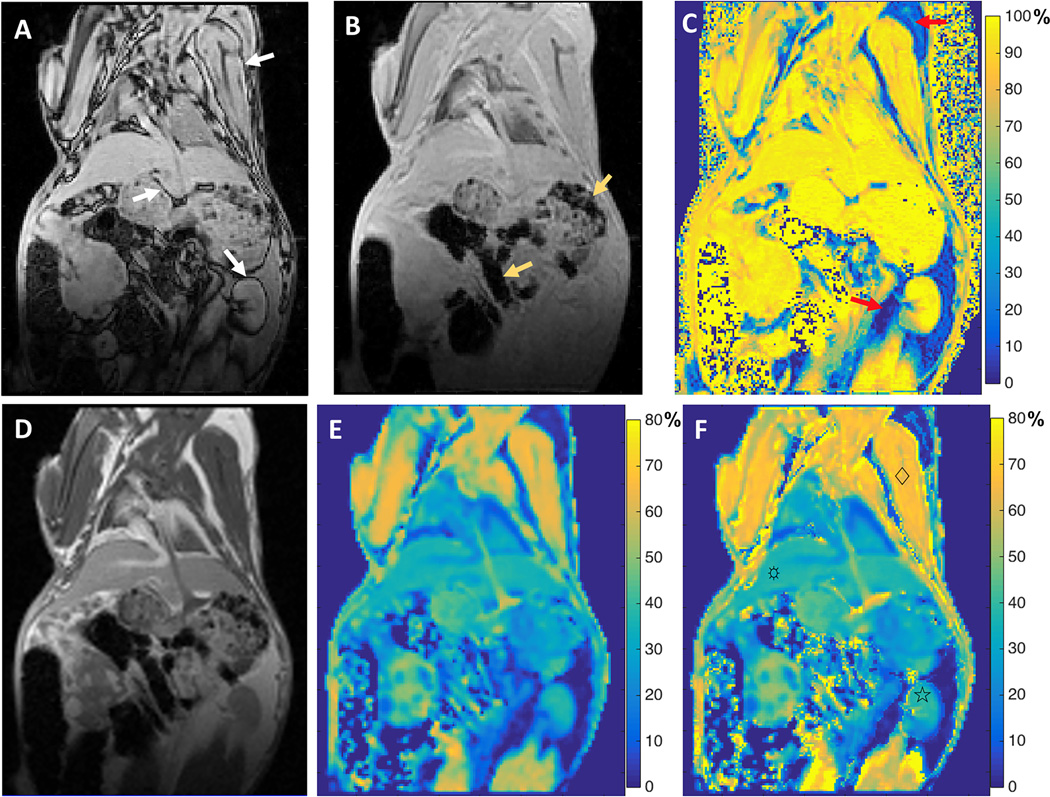
Fig. 5.
Images acquired on a rabbit. A. Opposed-phase image with TE = 1.19 ms; B. in-phase image with TE = 2.46 ms; C. corresponding water fraction map; D. MT weighted images with water and fat signals in phase (TE = 2.24 ms); E: corresponding MTRobs map; and E. calculated MTRtrue map. Slight increases in calculated MTR values were observed for skeletal muscle (♢), liver (☼), and kidney (☆) (MTRobs values of 61.90 ± 3.37, 35.18 ± 1.03, and 37.36 ± 1.23, MTRtrue values of 66.44 ± 2.73, 36.60 ± 1.06, and 38.35 ± 1.38 respectively).

