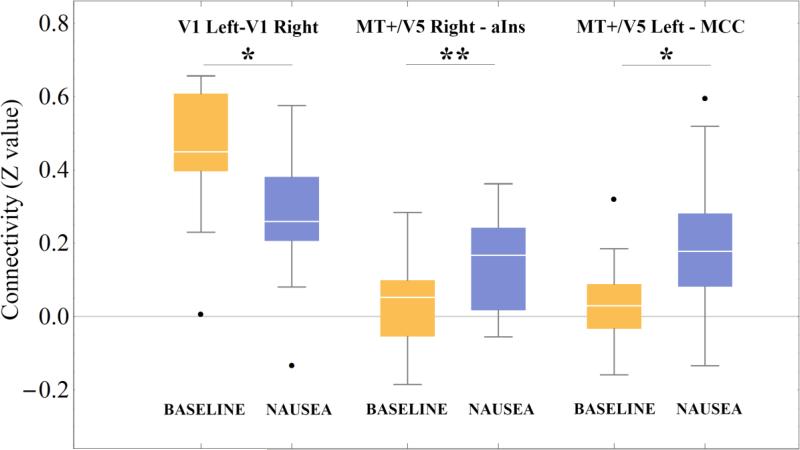
Figure 2.
Connectivity (Fisher r-to-Z transformed Pearson correlation coefficients) associated with baseline (BASELINE) as well as stimulus (NAUSEA) conditions for connections between right and left V1, between right MT+/V5 and anterior insula (aIns), and between left MT+/V5 and MCC. *=p<0.05, **=p<0.01, FDR corrected across all pairs of ROIs. Black dots: outliers.

