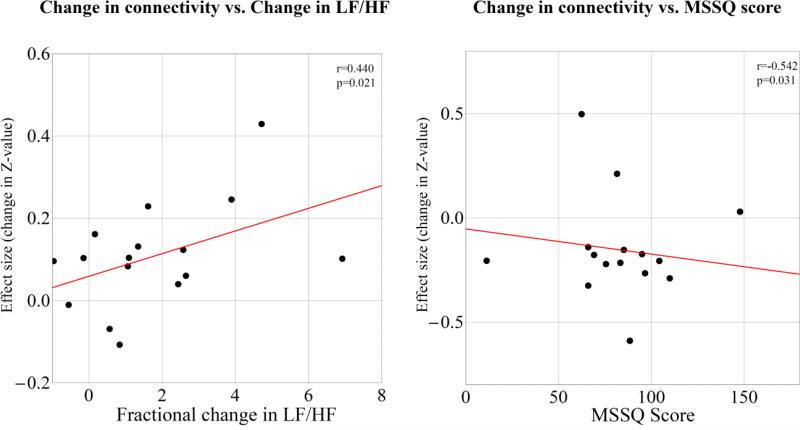
Figure 4.
Changes in connectivity in the NAUSEA state with respect to the BASELINE state as a function of fractional change in LF/HF ratio (left) and MSSQ score (right). “Effect size” is the difference in Z-values (Fisher r-to-Z transformed Pearson correlation coefficients) between the NAUSEA and the BASELINE state. Linear regression line is shown in red for visualization purposes.

