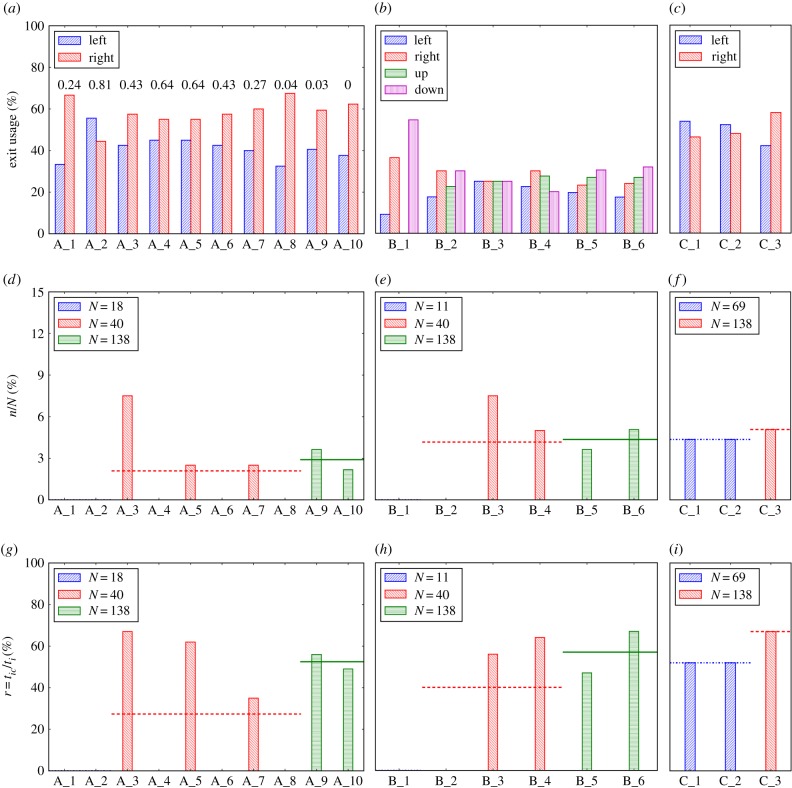
Figure 2.
Experimental results. (a–c) The exit usage for each run of experiments A, B and C, respectively. We show the percentage of the total number, N, of pedestrians for each exit in the experiments. Recall that in experiment A (a), the right exit was wider; in experiments B_5 and B_6, the top and bottom exits were wider; and in experiment C_3, the right exit was wider. In all other experiments, all exits had the same width. The numbers in panel (a) represent the p-value for each run from a binomial test with the hypothesis that pedestrians choose either exit with equal probability. For large pedestrian numbers (A_8, A_9 and A_10), the p-values are below 0.05, which means it is unlikely that the preference for the wider (the right) exit has arisen by chance. (d–f) The occurrence frequency of path re-planning behaviour, n/N, in each run of experiments A, B and C, respectively. Here, n represents the number of the pedestrians who changed their route choice. (g–i) The mean value of the ratio, r = tic/ti, for each run of experiments A, B and C, respectively. ti is the egress time of the individuals with path re-planning behaviour, and tic is the estimated time at which a change of route choice was displayed. The ratio r captures the time point during experiments at which changes in route choice occurred (0% implies at the start and 100% implies at the end of experiments). The horizontal lines denote the average value for runs with the same initial conditions. (Online version in colour.)

