Figure 3.
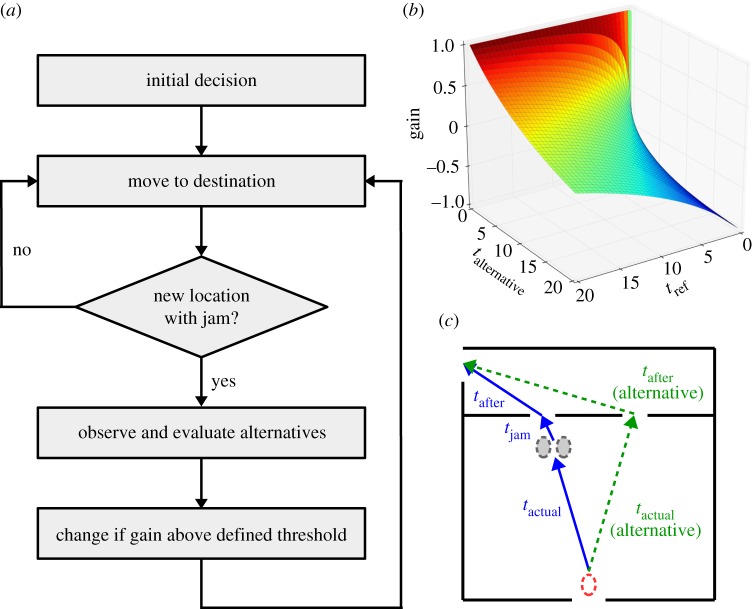
Route choice algorithm for individual pedestrians. (a) Outline of the route choice algorithm. An initial decision on a route can be revised later if individuals are in a queue or reach an intermediate target. Individuals assess their relative preference for different routes using a gain function (see equation (3.1)), which is zero for similar routes and tends to −1 or 1 when the difference between routes is large. Panel (b) shows this gain function plotted against estimated times to complete a reference and an alternative route (see text and equation (3.1) for details). (c) Example to illustrate travel time estimation of individuals. A pedestrian (shown as a dashed red oval at the bottom of the panel) has to choose between two routes. One exit is clear (dashed green lines) and the other is blocked by a short queue (solid blue lines). The estimated travel time is the sum of the time needed to reach a queue or exit location (tactual), the expected time of waiting in a queue (tjam) and the time needed to reach the final target after passing through an exit (tafter). Simulated pedestrians compare the relative merit of the alternative routes using the gain function shown in equation (3.1). (Online version in colour.)

