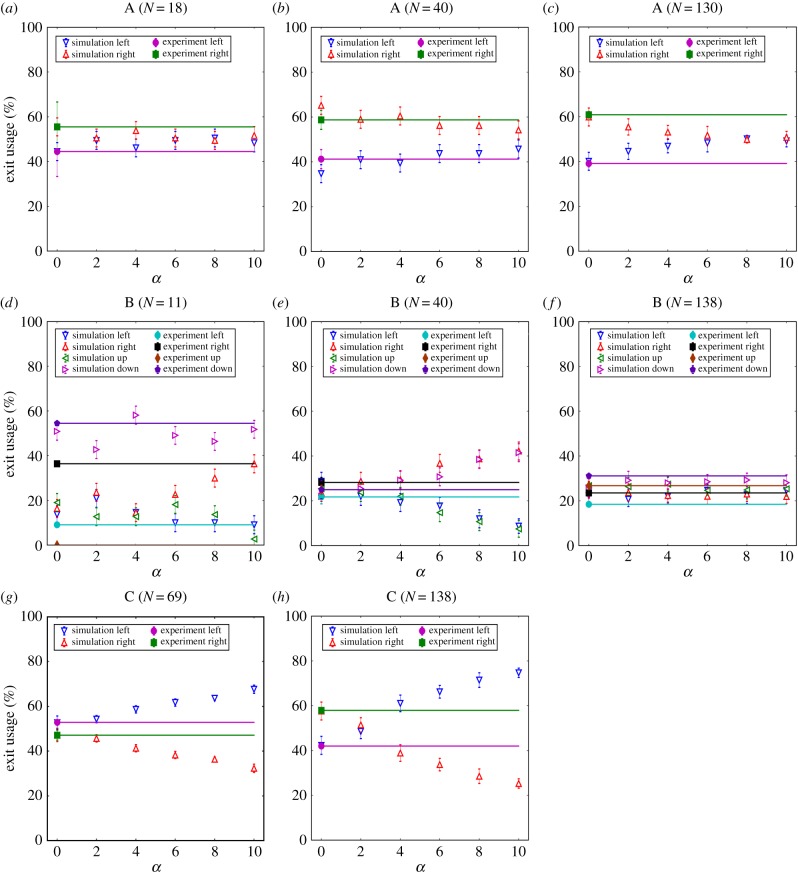
Figure 5.
Sensitivity analysis for the model parameter α which controls the relative weighting of a preference for nearer exits in the initial route choice of pedestrians. Parameter calibration was performed separately for each scenario A, B and C and number of pedestrians, respectively. The parameter sets that minimized dist for each scenario are listed in the electronic supplementary material, table S4. For each scenario, the simulation was conducted 10 times with pedestrians randomly distributed within their allocated starting positions (holding areas, figure 1d–f). We report mean values across replicates alongside 1 s.d. The experimental data are the average value for runs with the same initial conditions. (Online version in colour.)

