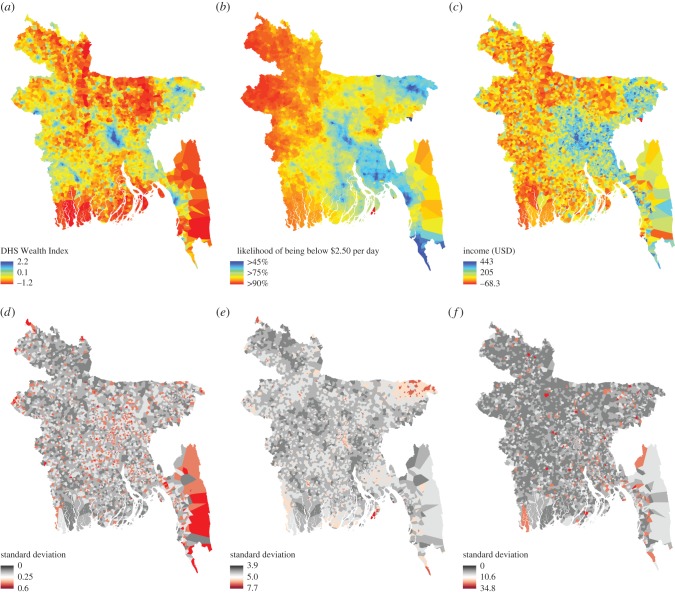
Figure 2.
National level prediction maps for mean WI (a) with uncertainty (d); mean probability of households being below $2.50/day (b) with uncertainty (e); and mean USD income (c) with uncertainty (f). Maps were generated using call detail record features, remote sensing data and Bayesian geostatistical models. The maps show the posterior mean and standard deviation from CDR–RS models for the WI and income data (a,c), and the RS model for the PPI (b). Red indicates poorer areas in prediction maps, and higher error in uncertainty maps.

