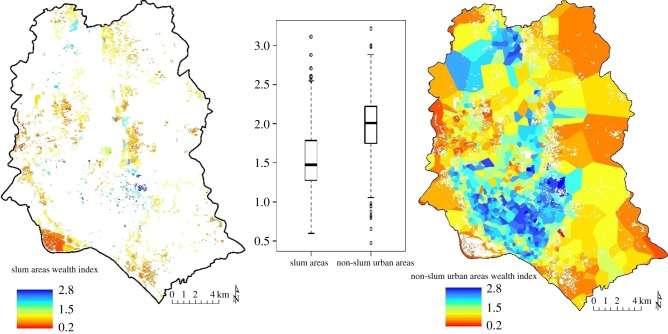
Figure 4.
Comparison of predicted mean DHS WI values between slum and non-slum areas in Dhaka as delineated by Gruebner et al. [63] t615 =−17.2, p < 0.001. The 95% confidence interval using Student's t-distribution with 615 degrees of freedom is (−0.48, −0.38).

