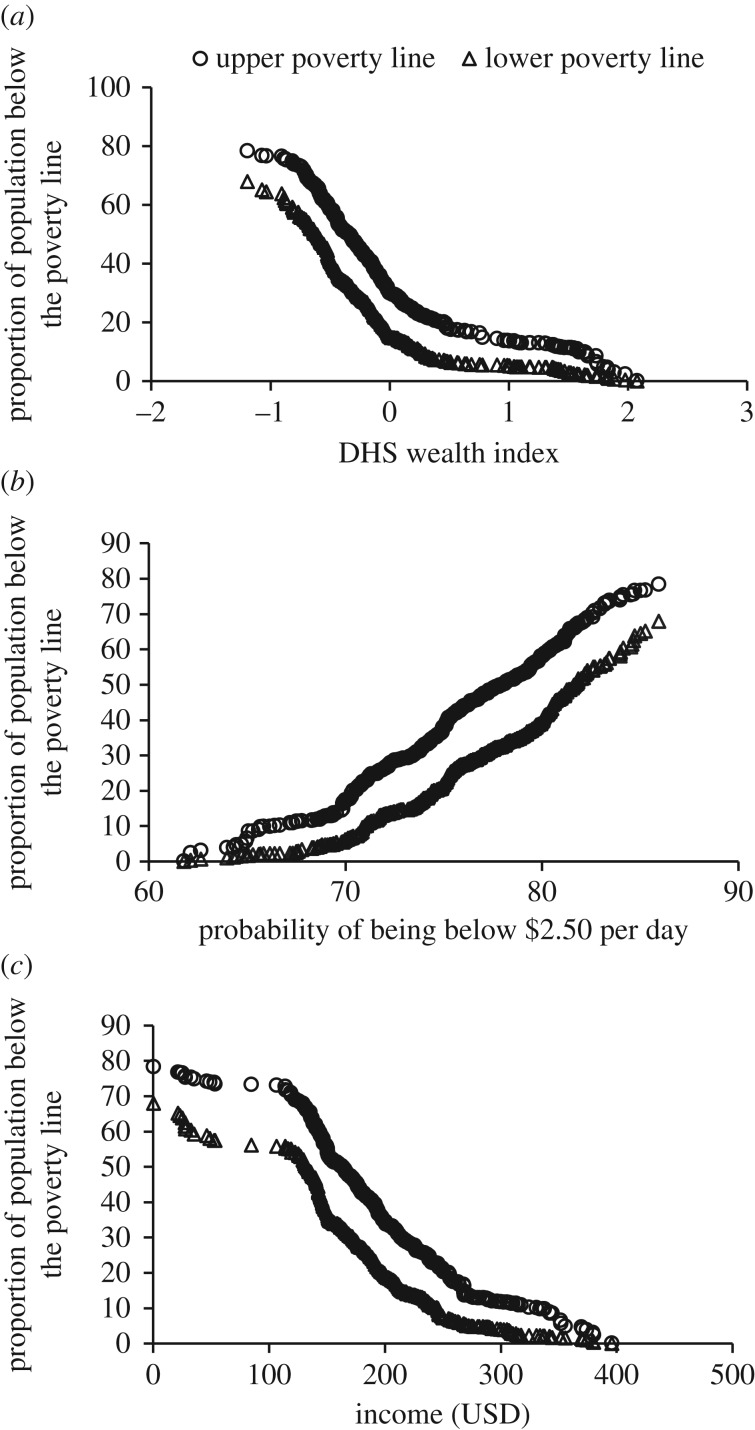
Figure 5.
Comparison of the proportion of people falling below upper (circles) and lower (triangles) poverty lines estimated by Ahmad et al. [64] and (a) predicted mean WI using mobile phone and remote sensing data, (b) predicted probability of being below $2.50 per day using remote sensing data and (c) predicted income using mobile phone and remote sensing data. All models were predicted at the upazila scale (Admin unit 3). Pearson's r correlations: −0.91 and −0.86 for the WI; 0.99 and 0.97 for the PPI; and −0.96 and −0.94 for income, respectively (p < 0.001 for all models).

