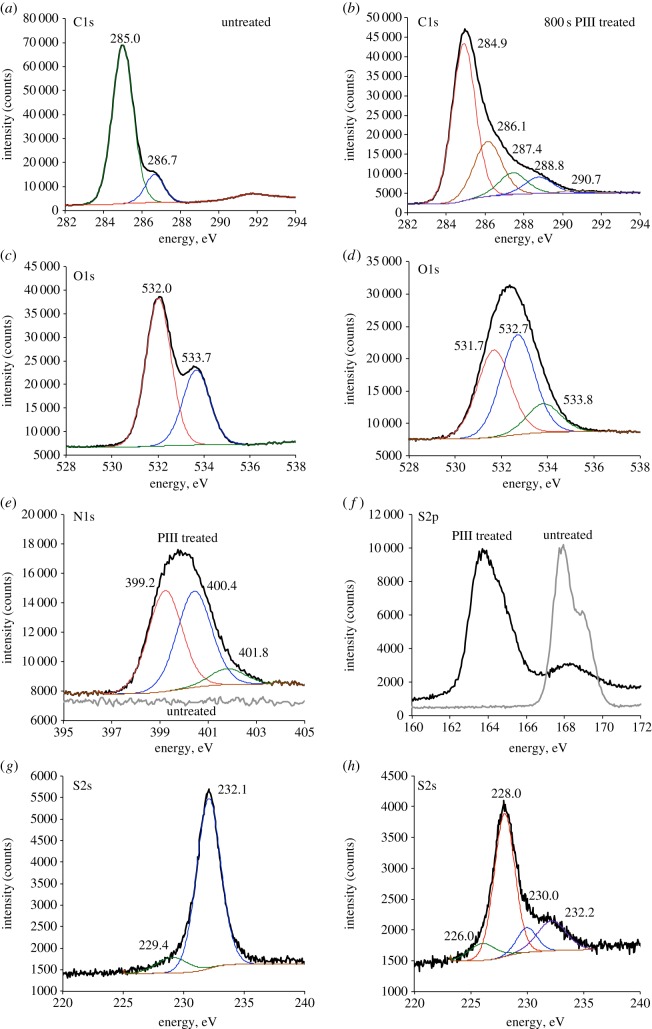
Figure 3.
XPS of untreated and PIII-treated PES. C1s peaks of untreated (a) and 800 s PIII-treated (b) PES. O1s peaks of untreated (c) and 800 s PIII-treated (d) PES. N1s peaks of untreated and 800 s PIII-treated PES are shown on the same graph (e). S2p peaks of untreated and 800 s PIII-treated PES are shown on the same graph (f). S2s peaks of untreated (g) and 800 s PIII-treated (h) PES. C1s, O1s, N1s and S2s peaks were fitted using a sum of Lorenz functions with the positions of peak maximums indicated in the corresponding figures.

