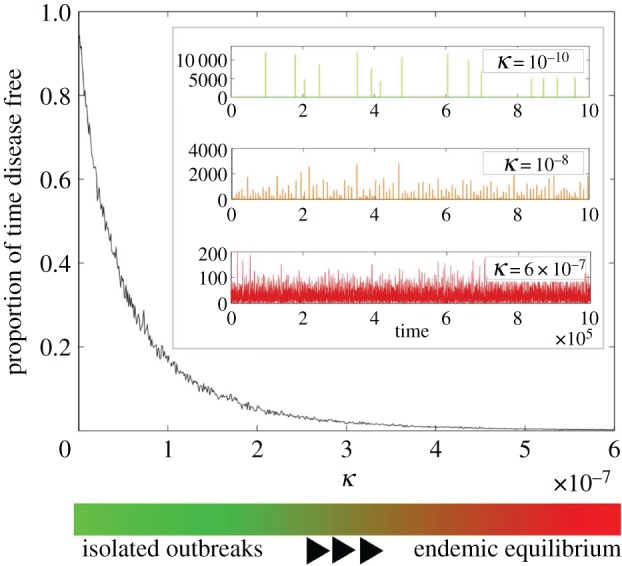
Figure 2.

A measure of outbreak vulnerability as a function of the reservoir transmission rate κ. The figure, based on 103 stochastic simulations run for 106 days for a population N = 500 000, shows the proportion of disease-free time for a given κ. The inlay shows three representative time series of the number of cases of EVD over a sample of 105 days. All parameters are set to the values in table 2 except κ, which is noted in each graph.
