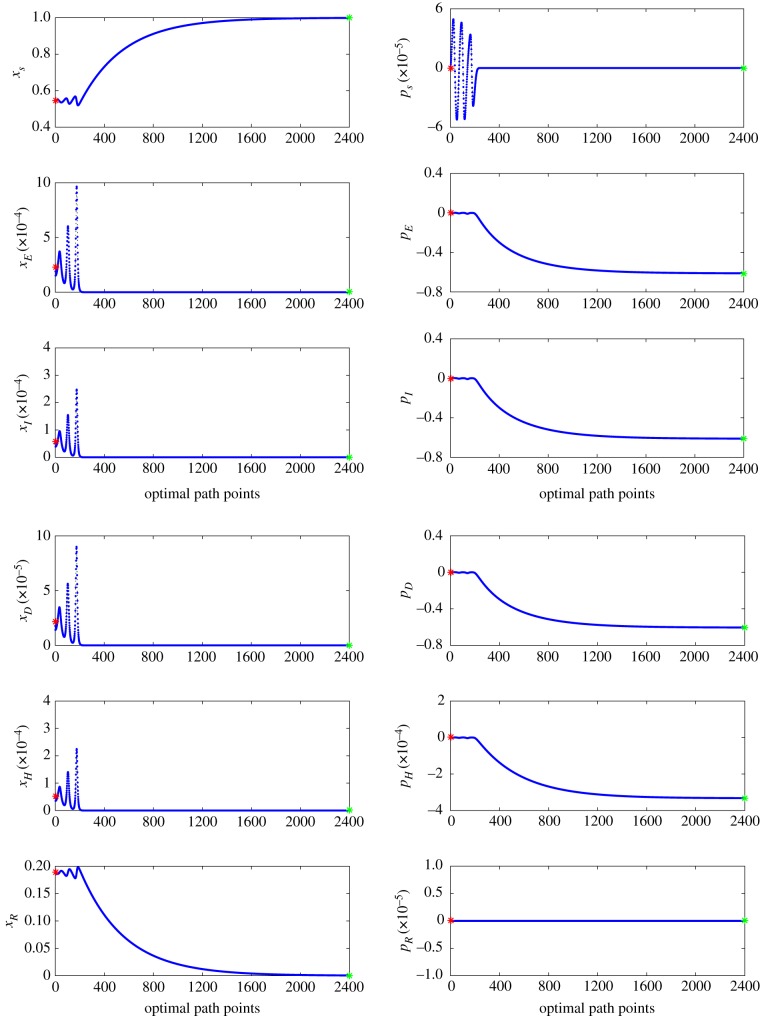
Figure 7.
The parameters are given in table 2, with the exception of κ = 0. Each set of 2400 blue points represent the numerical approximation of the optimal path to extinction found by the IAMM. The maximum error for this set is 2.4487 × 10⁻¹⁰. The red star represents the location of the endemic state (left starting point) and the green star represents the location of the extinct state (right-end point). (Online version in colour.)

