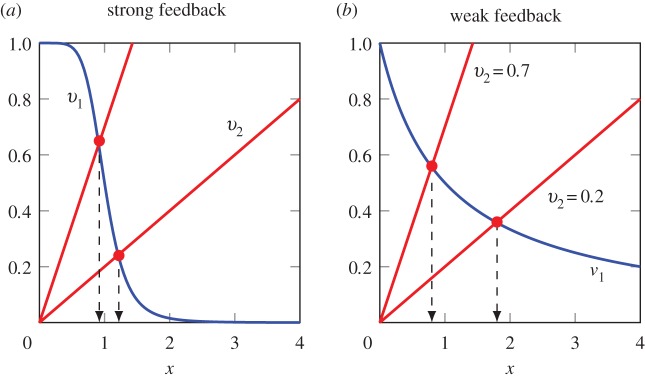
Figure 6.
Plot of  and
and  versus the concentration of X for a simple two step pathway with negative feedback. Two perturbations in
  that determines
  are shown. In panel (a), where the feedback is strong, changes in
  have hardly any effect on X. In the panel (b), the same change in
  results in a much larger change in X. This illustrates the homeostatic effect of negative feedback. (a)
  and (b)
  . (Online version in colour.)

