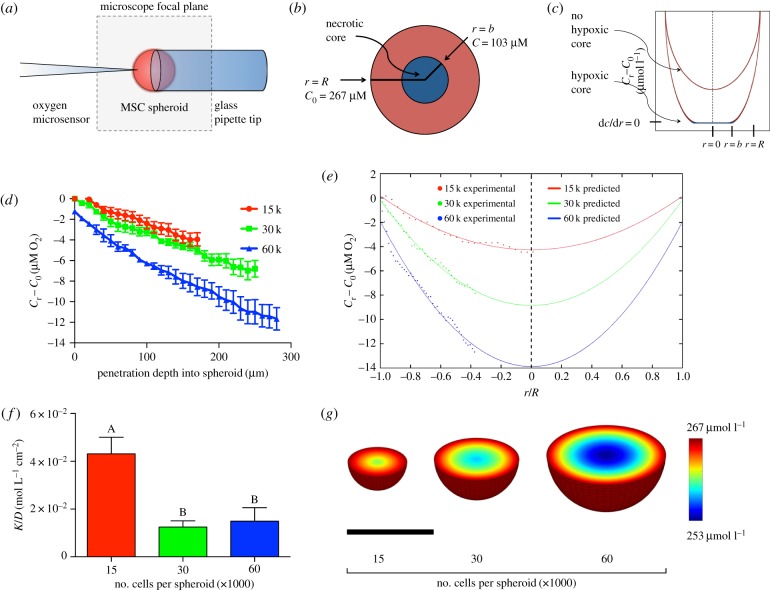
Figure 1.
Numerical prediction of oxygen tension within MSC spheroids. (a) Experimental set-up of the oxygen microsensor and MSC spheroid; (b) diagram demonstrating the presence/absence of a hypoxic core; (c) theoretical schematic demonstrating the effect of the presence/absence of a hypoxic core on the oxygen tension profile; (d) measured oxygen tension values as a function of distance into the spheroid (n = 5). (e) Using the measured oxygen tension values, a mathematical model was generated from the averaged data for each spheroid size using equation (2.5) and was plotted alongside the averaged oxygen tension values at each point within the spheroid. (f) K/D was calculated for each spheroid from the measured oxygen tension values (n = 5). (g) Oxygen tension as a function of radius was visualized in the three-dimensional space by mapping the mathematical model over the cross section of a sphere of the appropriate diameter. Scale bar represents 250 µm. Groups with no significance are linked by the same letters, while groups with significance do not share the same letters.

