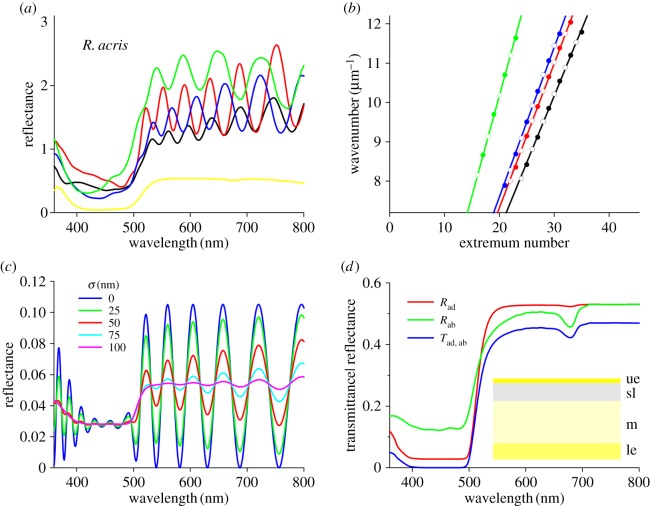
Figure 5.
Measurements and modelling of an R. acris petal. (a) Reflectance spectra of small areas measured in the main distal area of the petal. The oscillating spectra are from areas with gloss; the yellow curve was obtained from a matte area, that is, where the surface reflections were outside the aperture of the MSP's objective. (b) Wavenumber values of the oscillation extrema. The linear fits to the extrema wavenumbers (closed symbols: maxima; open symbols: minima) yielded thickness values of the upper epidermis. (c) Modelling the reflectance of the upper epidermis with varying thickness. (d) Modelling reflectance (R) and transmittance (T) spectra of a buttercup petal considered as a stack of layers with different absorption and scattering coefficients (ad: adaxial; ab: abaxial; ue: upper epidermis; sl: starch layer; m: mesophyll; le: lower epidermis).

