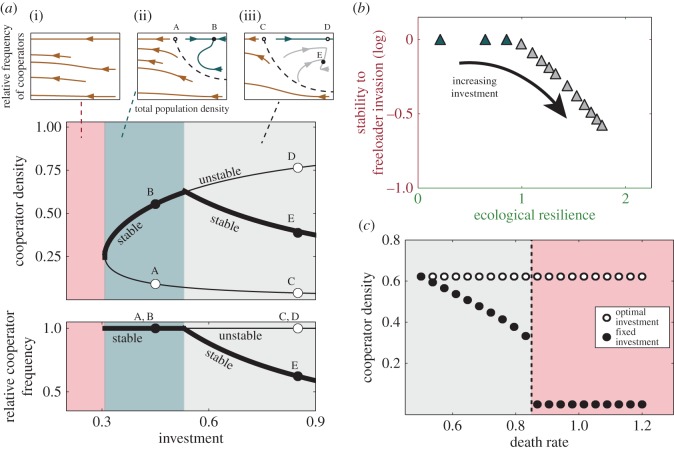
Figure 2.
Fixed investment strategies can beat the trade-off within a certain investment range. (a) A bifurcation diagram for the EPGG with unconditional cooperators using the fixed investment as a control parameter is shown. The diagram is split into three regions. Below the critical investment, ic1, cooperators invest too little to support any non-zero population, leading to population collapse (red region, eco-evolutionary phase portrait (i)). Above the critical investment ic1, there is a range of investment levels (blue region, (ii)) for which cooperators are non-invasible by freeloaders. This region ends at the critical investment ic2; above this investment, cooperators can be invaded by freeloaders (grey region, (iii)). The insets (i), (ii) and (iii) are example phase portraits for the red, blue and grey regions, respectively. (b) The stability to freeloader invasion is plotted against the ecological resilience for increasing investment. (c) An optimal fixed strategy for a particular environment (death rate d = 0.5) becomes sub-optimal as the environment changes, increasing the death rate, and it eventually leads to population collapse (experimental observation of this was reported in [13]). For all plots: r = 5, N = 8; for (a,b), d = 0.8; and for the insets (i), (ii) and (iii) in (a), respectively, i = 0.2, i = 0.45, i = 1.0. (Online version in colour.)

