
Figure 3.
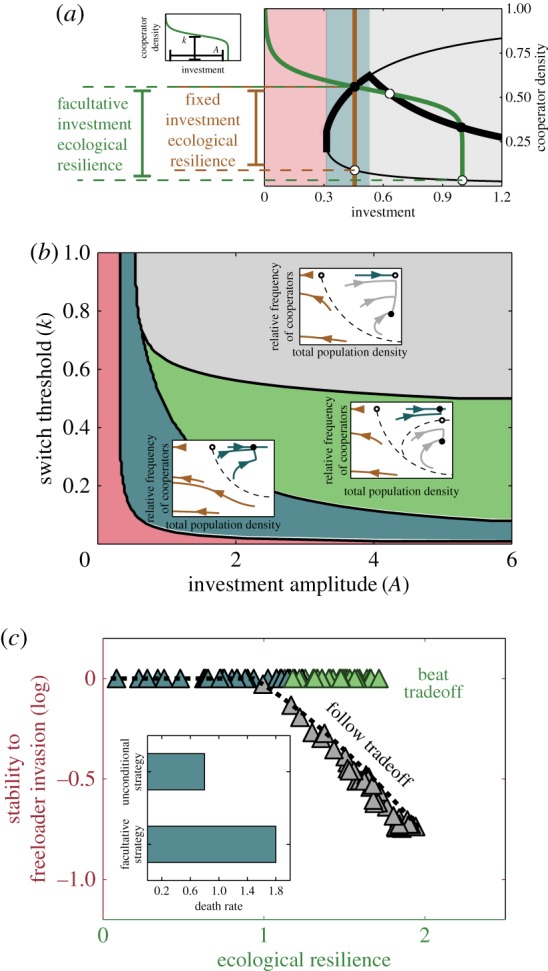
Facultative investment strategies allow cooperating populations to beat the trade-off. (a) The same bifurcation diagram depicted in figure 2a, with a facultative cooperator's investment strategy overlaid in green (equation (2.4); inset) and a fixed investment strategy overlaid in brown. The intersections between the investment strategies and the bifurcation diagram indicate fixed points. The stability of the fixed points was then analysed using standard methods and shown by the open (unstable) and closed (stable) circles. The facultative strategy produces two stable and two unstable fixed points aside from a line of stable extinction points. (b) A phase diagram with example phase portraits for different regions of the space of strategies. In the red region, cooperators invest too little and cannot even support themselves. In the blue region, more investment is made and cooperators can support themselves but freeloaders cannot invade. In the green region cooperators are stable but so is the internal, mixed equilibrium point. The grey region leads to phase portraits similar to those observed for unconditional cooperators, with a stable, mixed equilibrium and three pure cooperator equilibria. (c) We plot the stability to freeloader invasion against the ecological resilience for 100 different facultative strategies randomly sampled from the strategy space in (b). Points are coloured to represent the region of the strategy space to which they belong. Strategies in the grey region follow the same trade-off reported above for the fixed strategies (black dashed line). However, strategies in the blue and green region may beat the trade-off, and are able to reach very high ecological resiliencies without compromising their evolutionary stability to freeloader invasion. The inset shows how facultative cooperators are capable of surviving harsher conditions. The optimal strategy for both the fixed and facultative cooperators was calculated for one death rate. At other, larger death rates, up to d ∼ 1.8, facultative cooperators are still capable of surviving while fixed investment cooperators are not. The parameters used in (a) are: A = 1.0 and k = 0.55 (for the facultative strategy) and i = 0.46 (for the fixed investment strategy). The parameters used for the insets in (b) are: A = 0.6, k = 0.4 for (i), A = 1.0, k = 0.55 for (ii), and A = 1.2, k = 0.8 for (iii). The parameters used for the inset in (c) are: A = 0.7 and k = 0.68 for the facultative strategy and i = 0.52 for the fixed investment strategy. In all plots: r = 5, N = 8, and d = 0.8. (Online version in colour.)