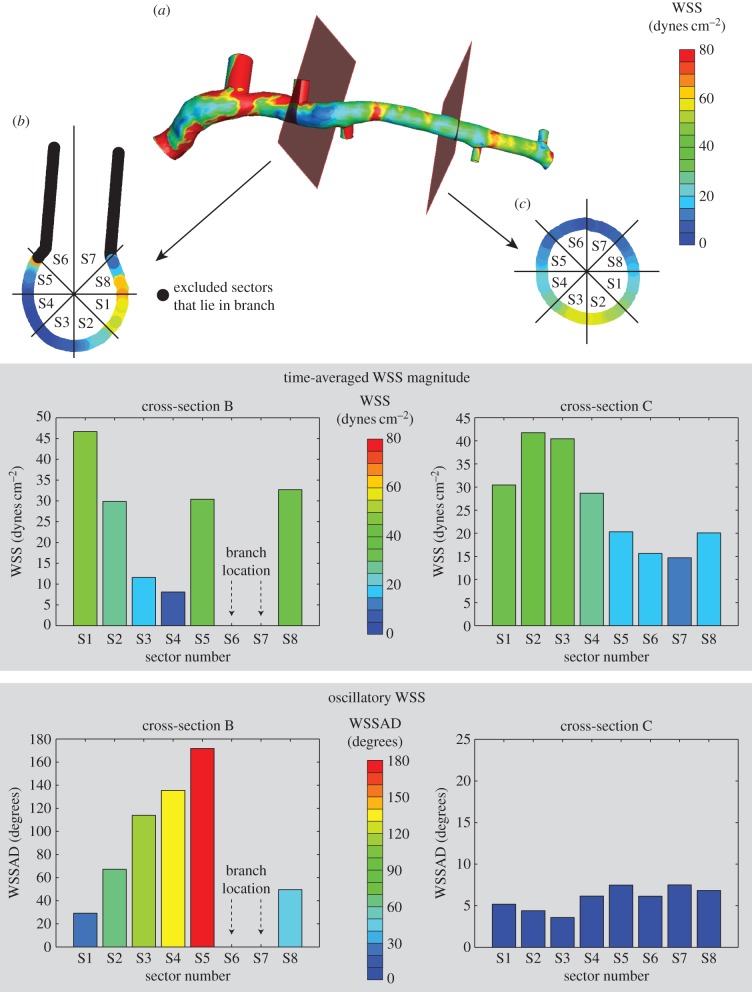
Figure 4.
Quantification of the focal haemodynamic environment. (a) WSS data are extracted from the computational geometry at the location of the VH-IVUS images. (b,c) Time-averaged WSS magnitude and oscillatory WSS data are divided up into sectors, and values are averaged within each sector. Sectors with nodes within branching vessels were excluded from the analysis.

